AMAZON multi-meters discounts AMAZON oscilloscope discounts
(cont. from part 1)
3. Primary indicating systems
3.1 Engine speed
This is a primary engine indication used on both piston and gas turbine engines. It is one of two methods used to indicate thrust on gas turbine engines (the other being EPR). In gas turbine engines, the usual practice is to display a percentage of maximum revolutions per minute (r.p.m.) rather than actual r.p.m.
Typical gas turbine engine speeds are in the order of 8000-12,000 r.p.m. The mathematical notation for rotational speed is N; gas turbine engines can have up to three shafts (or spools), these are referred to as low, intermediate and high-pressure shafts (LP, IP and HP). Alternatively, they are referred to numerically; the individual shaft speeds are therefore N1 N2 and N3 . Engine speed is monitored by the crew at all times; particularly during start and take-off to make sure that engine limits are not exceeded. The two principal types of engine speed transducer are the tachometer and variable reluctance device.
===========
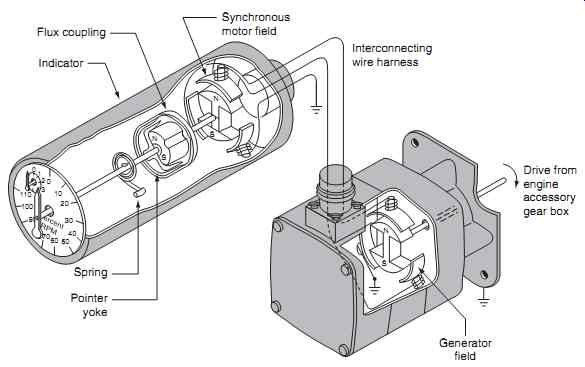
FIG. 14 Tachometer system schematic
Synchronous motor field; Interconnecting wire harness; Drive from engine accessory gear box; Flux coupling; Spring; Pointer yoke; Generator field; Indicator
===========
3.1.1 Tachometer system
The tachometer indicating system is a small three phase AC generator connected via a mechanical link to engine accessory gearbox. A tachometer system is found on most general aviation aircraft. Referring to fundamental principles, the tachometer's output increases with increased engine speed; the output is rectified and connected to a moving coil meter. The output from the generator is supplied to a three-phase AC synchronous motor in the indicator; see FIG. 14 .
The AC generator tachometer consists of a permanent magnet that is rotated inside stator windings wound in a three-phase star configuration. Three stator outputs are connected to the stator windings of the motor. As the engine turns, the permanent magnet induces currents in the stator windings. The three-phase output induces a rotating field in the motor stator windings.
Referring to FIG. 15, a permanent magnet is attached to the rotor shaft of the synchronous motor; this is connected to the pointer of the indicator. As the stator field rotates, the permanent magnet keeps itself aligned with the field. A second permanent magnet is attached to the indicator rotor; this is located within a drag cup , see FIG. 16 . As this second magnet rotates, it induces eddy currents in the drag cup. These currents produce their own magnetic fields in opposition to the rotating magnet.
When the rotating magnet increases in speed, the drag (or torque) on the drag cup increases. A hair spring attached to the shaft opposes this torque; the net result is the pointer moves across the scale in pro portion to the speed of the engine shaft.

FIG. 15 Tachometer system installation
3.1.2 Variable reluctance
The N1 variable reluctance speed transducer comprises a coil wound onto a permanent magnet core as shown in FIG. 17. This type of sensor is found on most gas turbine engines. When the blade tip passes the sensor, the magnetic field is disturbed.
This induces a voltage into the coil; as the shaft speed increases the fan tips pass the sensor at an increase rate. The output from the coil is in the form of volt age 'spikes'. These are counted by a processor and used to determine engine speed. Some engines are fit ted with a low permeability material inserted into the blade tip to provide a distinctive pulse each time that a specific blade passes the sensor.
The N2 speed transducer is located within the accessory gearbox, see FIG. 18 . A gearbox-driven target wheel contains a permanent magnet inserted on the periphery of the wheel. The coil/core sensor field is disturbed each time that the target passes the sensor. The out put is supplied into a processor that drives the indicator.
=========
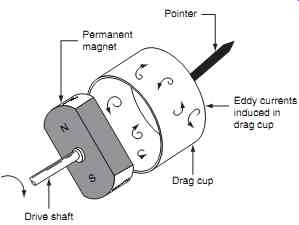
FIG. 16 Drag cup features
Eddy currents induced in drag cup; Pointer N S; Permanent magnet; Drag cup; Drive shaft
=========
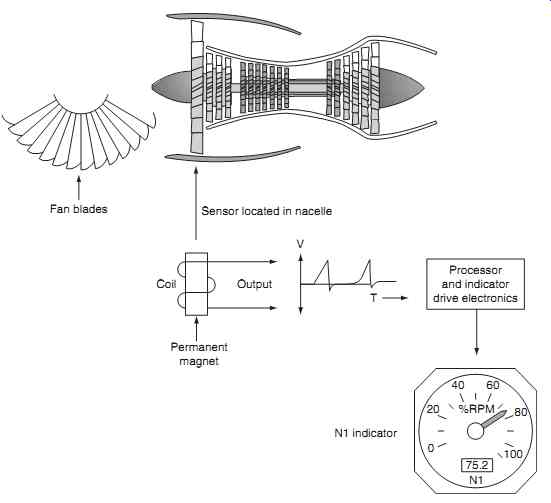
FIG. 17 N1 engine speed indication
Fan blades; Permanent magnet; N1 indicator; Coil; Output; Sensor located in nacelle; Processor and indicator drive electronics
===========
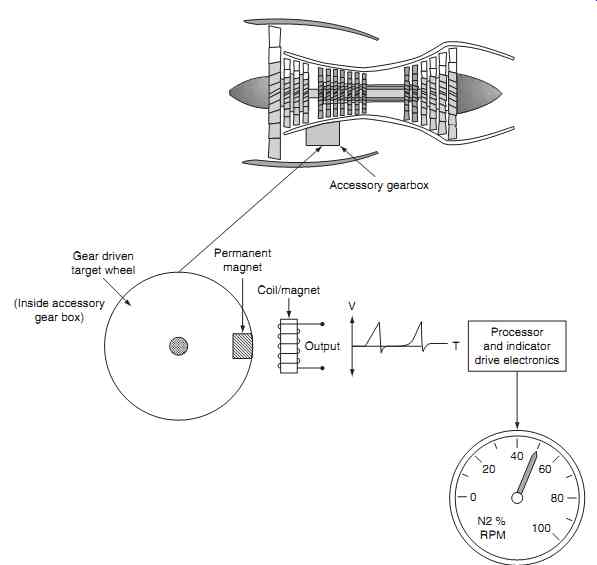
FIG. 18 N2 engine speed indication
Processor and indicator drive electronics; Gear driven target wheel (Inside accessory gear box); Permanent magnet; Coil/magnet; Output
============
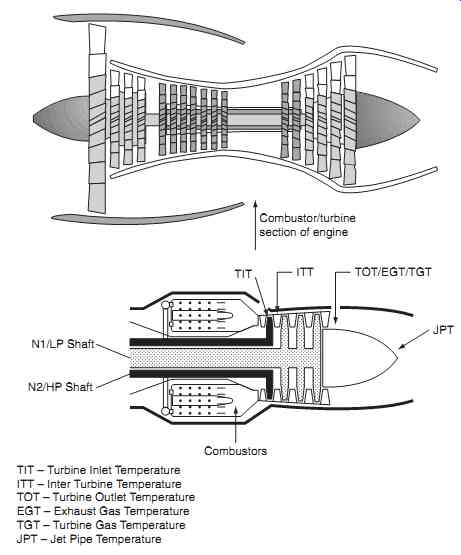
FIG. 19 Engine temperature measurement
N1/LP Shaft; N2/HP Shaft; Combustors; ITT JPT TOT/EGT/TGT; Combustor/turbine section of engine
TIT - Turbine Inlet Temperature ITT - Inter Turbine Temperature TOT - Turbine Outlet emperature EGT - Exhaust Gas Temperature TGT - Turbine Gas Temperature JPT - Jet Pipe Temperature TIT
==============
Test your understanding
Explain the terms N1, N2 and N3. How do these relate to the HP, IP and LP shafts?
3.2 Engine temperature
Exhaust gas temperature is a primary gas turbine engine indication. Engine temperature is closely monitored at all times, particularly during start and take off, to make sure that engine limits are not exceeded.
It is sometimes referred to as:
- turbine inlet temperature (TIT)
- inter-turbine temperature (ITT)
- turbine outlet temperature (TOT)
- exhaust gas temperature (EGT)
- turbine gas temperature (TGT)
- jet pipe temperature (JPT)
The type of measurement depends on where the probe is located and according to individual engine manufacturer's terminology; FIG. 19 illustrates some of these locations. The turbine section runs at very high temperatures, typically 1000ºC; the transducer used in this application is the thermocouple (sometimes referred to as a 'temperature probe').
A typical engine temperature measurement sys tem is illustrated in FIG. 20 . On larger engines, it is possible to have a range of temperatures in the exhaust zone due to the turbulence of gases.
Some installations feature a thermocouple that has two or even three hot junctions within the same outer tube. This arrangement provides an average of temperature within the zone to provide an average temperature at different immersion distances in the engine, see FIG. 21.
Key point
Thermocouple junctions alone do not generate electromotive force (e.m.f.). The potential difference that develops at the heated junction is a function of both the hot and cold junction temperatures.
Small gas turbine engines are normally fitted with several thermocouples to provide an average temperature and some redundancy in case of failure.
Larger engines can be fitted with up to 21 thermocouples; these are connected in parallel to provide an average reading of the gas temperature in the exhaust zone. The interconnecting cables between the thermocouple(s) and indicator have to be the same material throughout the system otherwise addition junctions will be formed, thereby generating unwanted voltages. A typical thermocouple cable installation is shown in FIG. 22.
============
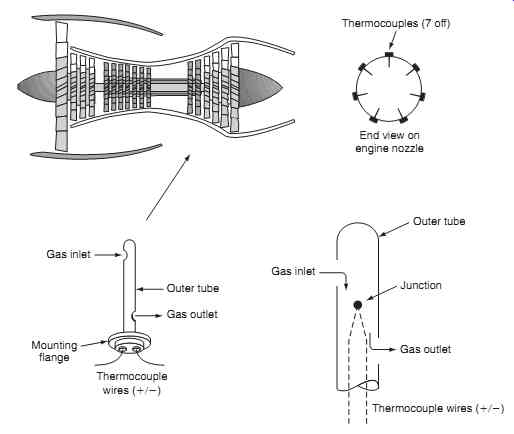
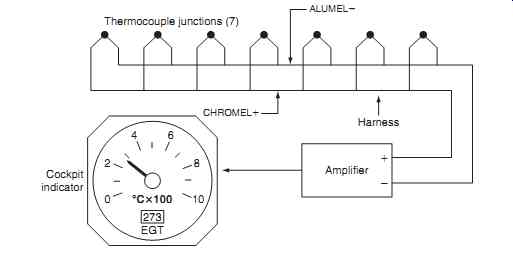
FIG. 20 Engine temperature system
Amplifier CHROMEL +; ALUMEL -Harness; Cockpit indicator; Thermocouple junctions (7); Thermocouples (7 off); End view on engine nozzle; Gas inlet; Gas inlet; Gas outlet; Thermocouple wires; Thermocouple wires; Junction; Outer tube; Gas outlet; Mounting flange; Outer tube
=============
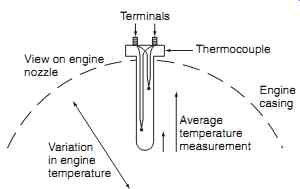
FIG. 21 Average temperature measurement
Thermocouple; Average temperature measurement; Engine casing; Variation in engine temperature; Terminals; View on engine nozzle
=============
FIG. 22 Thermocouple/cable installation
=============
Key maintenance point
Thermocouple cables are color-coded to reduce the likelihood of different materials being cross-connected, or mixed in the same installation (note that these codes vary in some countries; always refer to the maintenance manual):
• nickel-chrome (white)
• nickel-aluminum (green)
• iron (black)
• constantan (yellow)
• copper (red)
On piston engines, the EGT indication has a different application; it is used to adjust the fuel-air mixture for economical running of the engine. The thermocouple is located in located in the exhaust system, reducing the amount of fuel into the cylinders (called leaning the mixture); this results in a more efficient combustion and the exhaust tempera ture increases. When this temperature reaches a peak, maximum efficiency has been achieved. Using one thermocouple per cylinder averages out individual differences and provides enhanced fuel efficiencies.
Piston engines also use thermocouples to monitor the cylinder head temperature (CHT). This indication is used to monitor the temperature of an air-cooled engine. The system can be arranged with either one CHT thermocouple per cylinder or just one CHT thermocouple per engine. In the latter case, the thermocouple is installed in the hottest running cylinder; on a horizontally opposed engine this would be the rear cylinder. The thermocouple can be formed to fit under the spark plug or directly into the head itself.
The advantage of monitoring each cylinder is that trend indications can be derived.
Test your understanding
Why are thermocouple cables color-coded?
3.3 Engine pressure ratio (EPR)
This is a primary gas turbine engine indication system and is one of two methods used to indicate thrust (the alternative method is described under engine speed). The principle of an EPR indication system is to measure the exhaust and inlet pressures and derive a ratio between them. EPR probes are located at the inlet and exhaust of the engine, see FIG. 23 . The inlet pres sure probe is a single device, located in the nacelle; there can be several exhaust probes connected via a manifold.
Pressures from the inlet and exhaust are sent via small diameter pipes to the EPR transducer; this comprises pressure sensors (capsules). These are coupled to a mechanism that determines the displacement of the capsules as ratio. Outputs from the ratio sensor are sent via a linear variable differential transformer (LVDT) to the indicator. The EPR signal from the transducer is transmitted as a voltage to the indicator.
The typical range of EPR indications is between one and two.
Test your understanding
What EPR reading would be displayed when an engine is not running?
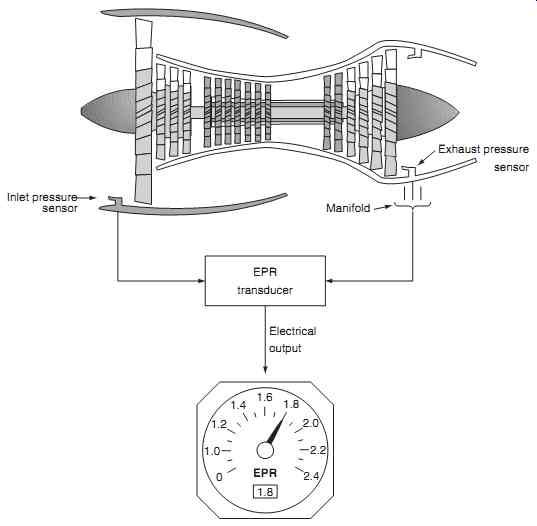
FIG. 23 EPR schematic--Inlet pressure sensor; EPR transducer; Exhaust
pressure sensor
3.4 Fuel flow
This is a primary engine indication for which there are various types of transducer; these are located in the fuel delivery pipeline. A typical transducer type is based on the metering vane principle; see FIG. 24 . The metering vane is attached to a shaft; this rotates when the fuel supply passes through the body of the transducer. The circular chamber has sufficient clearance to allow fuel to pass through with minimal restriction.
Rotation of the vane is opposed by a spring; the angular position of the vane is measured and indicated by a synchro system, see FIG. 25 . The metering vane system gives an indication of volume flow , e.g. gallons or liters of fuel flow per hour.
An alternative fuel flow transducer is the motor driven impeller principle; see FIG. 26 . An impeller is driven at a constant speed by an AC synchronous motor. The fuel that flows through the impeller is imparted with a rotational force; this causes the turbine blades to rotate against the force of a spring.
The speed of turbine rotation is therefore proportional to fuel flow. Denser fuel imparts more energy into the turbine; the transducer is therefore measuring mass flow. The turbine is connected to the indicator via a synchro system; typical units of mass flow are given in pounds or kilograms of fuel per hour.
===============
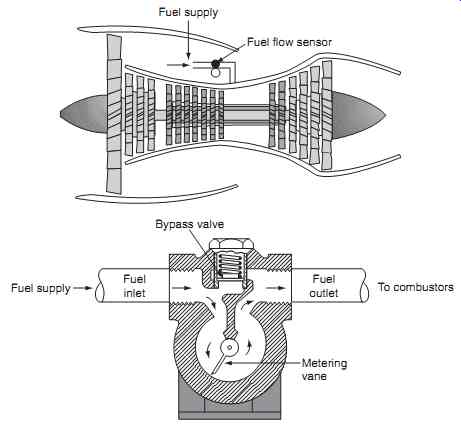
FIG. 24 Fuel flow-metering vane principles
Fuel supply; Metering vane; To combustors; Fuel supply; Bypass valve; Fuel flow sensor; Fuel inlet; Fuel outlet
===============
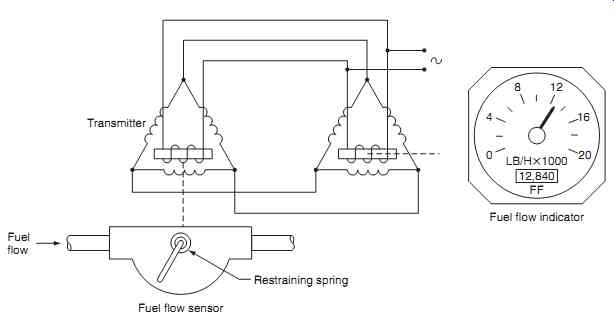
FIG. 25 Fuel flow indicating system
Fuel flow; Fuel flow sensor; Restraining spring; Transmitter; Fuel flow indicator
==============
3.5 Torque
The power delivered by the engine to the propeller shaft can be derived from the relationship: Power torque speed __
Power is derived from measuring both torque and speed; the indication is normally used for turboprops and helicopter rotors. Indicators are calibrated in a percentage of maximum torque or shaft horsepower (SHP). A typical torque indicator used on a twin engine helicopter is shown in FIG. 27.
Indications are given for the output from both engines and main rotor (M/R) torque. This is the most effective way of indicating the power being produced by the engine.
There are several methods used to measure torque.
The torque shaft is formed with toothed or phonic wheels , see FIG. 28 . As the applied torque changes the phase difference between the signals obtained from the two speed sensors increases. The torque applied to the shaft results in a phase difference between the out puts of the two sensors, see FIG. 29.
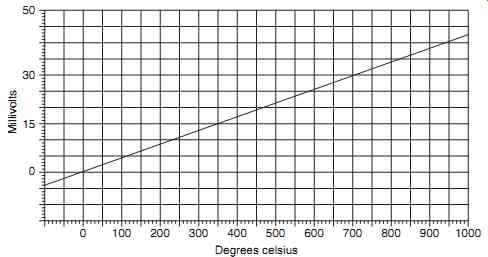
FIG. 26 Fuel flow - impeller principle
Torque can also be measured by embedding strain gauges into the shaft to measure the deformation (strain) of the shaft; these can either be metallic foil or semiconductor piezo-resistors (as described in Section 9).
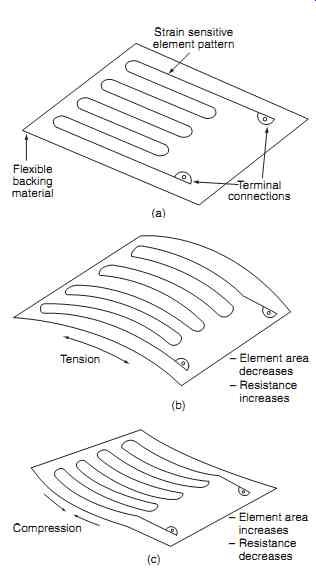
FIG. 27 Typical helicopter torque indicator (twin engine)
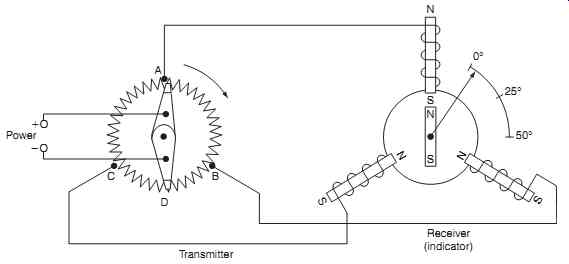
FIG. 28 Torque transducer principles
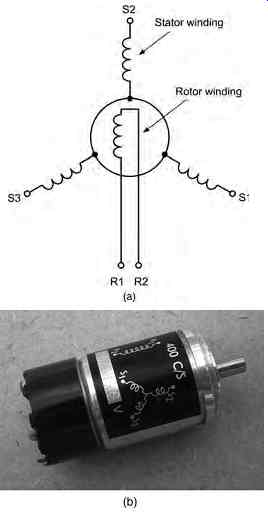
FIG. 29 Shaft torque sensor phase differences (a) no load conditions,
(b) engine lightly loaded, (c) engine heavily loaded.
Test your understanding
What is the difference between torque and thrust?
4. Secondary indicating systems
4.1 Oil/fuel temperature
There is a need for accurate measurement of fluid temperatures on and around the engine, e.g. fuel, engine lubrication (lube) oil and hydraulic oil. The typical temperature range of these fluids is between _ 40 and _ 150°C. When lube oil operates at high temperatures, its viscosity reduces and its lubrication performance decreases. This leads to engine wear and eventual failure of bearings or other engine components. When lube oil operates at low temperatures, its viscosity increases, which has an effect on starting. When fuel is exposed to high temperatures, it can vaporize, causing fuel delivery problems and a potential risk of explosion; at low temperatures, ice formation can occur leading to blocked filters. (Fuel systems are further described in Section 11.)
The flight compartment indicator is a moving coil meter connected in series with the resistance winding of a resistance temperature device (RTD); this item is described in more detail in Section 9. As the tempera ture changes, the resistance changes and this causes the pointer to respond accordingly. The meter is acting as an ammeter, but since there is a linear relationship between temperature and resistance, and since we know (from Ohm's law) that the current in a circuit will vary in accordance with resistance, the moving coil meter can be calibrated as a temperature indicator.
This is all very well provided that the power sup ply voltage does not change. To illustrate this problem, assume a given temperature and hence a specific resistance of the RTD. The effect of a varying power supply voltage will be to vary the current through the RTD and meter; this would change the reading even though temperature has not changed; an undesirable situation. The method employed to overcome this is a circuit called the Wheatstone bridge, as described in Section 9. This circuit has a number of applications and is ideally suited for the RTD.
4.2 Vibration
Unbalanced shafts on a gas turbine engine can cause damage, particularly at high rotational speeds. These conditions can be anticipated by measuring the engine's vibration. Sensors used to detect vibration are based on piezoelectric crystals; a small electrical charge is created when the crystal is vibrated. Each engine has a sensor(s) located at strategic locations; the output is fed into a processor and displayed on an indicator, see FIG. 30.
The output from the processor can also be used to illuminate a warning light when pre-determined limits are exceeded. A test switch (incorporated into the light) is used to energize a relay (or equivalent electronic switch); this inserts a known frequency into the processing circuit to generate a warning. The vibration warning circuit also activates the master caution system.
4.3 Fluid pressure
Typical fluid pressures being measured on the engine include lubrication oil and fuel. There are two basic methods used to measure fluid pressure: the Bourdon tube or a capsule. The Bourdon tube comprises a tube formed into a curved or spiral shape. As the applied pressure from the fluid system increases, the tube will tend to straighten out, while a reduced pres sure will cause the tube to return to its original shape.
This movement is transferred via the gear mechanism to move a pointer. The pointer moves across a scale, thereby providing a direct reading of pressure. The other method used for measuring fluid pressure is with a capsule . As pressure is applied by the fluid, the capsule expands. This moves an iron bobbin within the envelope of two inductor coils. (The principles of Bourdon tubes, pressure capsules and measurement systems are described in Section 9.)
4.4 Propeller synchronization
This is a mechanism that automatically synchronizes all propellers of a multiengine aircraft to ensure that they rotate at the same speed. The main reason for synchronizing the propeller speed is for the comfort of crew and passengers; propellers that are turning at slightly different speeds create a 'beat' through heterodyning. This is the creation of new frequencies through mixing two different frequencies; one at the difference of the two mixed frequencies, and the other at their sum. Heterodyning creates beats that can become very tiresome to persons inside the aircraft over long periods of time. Some aircraft are installed with a visual indicator of propeller synchronization.
Pilots can use this indicator to decide whether or not to engage automatic synchronization, or to assist with manually synchronization of propeller speeds by adjusting the throttles.
5. Electronic indicating systems
There are two formats of electronic indicating systems in widespread use on larger passenger aircraft: EICAS and ECAM. The Engine Indication and Crew Alerting System (EICAS) is a Boeing-developed system that provides all engine instrumentation and crew annunciations in an integrated format. The system used on Airbus aircraft is the Electronic
FIG. 30 Vibration sensor system: Signal conditioner (equipment bay)
FIG. 31 EICAS
Centralized Aircraft Monitoring (ECAM) system.
The two systems operate on different philosophies; however, their basic functions are to monitor aircraft systems and display relevant information to the pilots.
Both systems produce warnings, cautions and advisory messages that need to be evaluated by the crew.
In certain cases, the system provides the procedures required to address the problem. Each color display unit uses either an active matrix liquid crystal display (AMLCD) or a cathode ray tube (CRT).
EICAS is arranged with two displays in the center instrument panel (upper and lower), see Fig. 31 . ECAM uses either a left and right display, see FIG. 32 , or an upper and lower arrangement. The information displayed by EICAS/ECAM includes engine thrust, engine r.p.m., fuel flow, oil temperature and pressure. Graphical depiction of aircraft systems can also be displayed; this includes electrical, hydraulic, de-icing, environmental and control surface positions.
FIG. 32 ECAM
5.1 EICAS
System features include:
- primary engine parameters displayed on a full time basis
- secondary engine parameters displayed as required
- automatic monitoring of systems
- fault codes, fault history, self test (lower display)
- two computers (includes interfaces, symbol generator, memory)
- select panel, control switches, annunciation, standby display
This integrated system improves reliability through elimination of traditional engine gauges and simplifies the flight deck through fewer stand-alone indicators.
EICAS also reduces crew workload by employing a graphical presentation that can be rapidly assimilated.
A typical EICAS comprises two large high-resolution color displays together with associated control panels, two or three EICAS data concentrator units and a lamp driver unit. The primary EICAS display presents primary engine indication instruments and relevant crew alerts. It has a fixed format providing engine data including:
- engine thrust (EPR)
- engine rotational speed (N 1)
- exhaust gas temperature (EGT)
If N1 or EGT limits are exceeded, their respective pointers and digital readouts change from white to yellow, and eventually to red. Exceedance information is stored in non-volatile memory (NVM) for access by maintenance engineers when troubleshooting the systems.
Messages are displayed as part of the Caution Alerting System (CAS); these are color-coded to indicate their importance. Typical messages include low-pressure in the fuel or hydraulic oil systems, doors not closed etc. System warnings are automatically color-coded and prioritized; they are accompanied by an audible warning depending on the message priority:
- Warning messages are red, accompanied by an audio alert (prompt action is required by the crew).
- Caution messages are yellow accompanied by an audio alert (timely action is required by the crew).
- Advisory messages are yellow, no audio alert (time available attention is required by the crew).
The secondary EICAS display indicates a wide variety of options to the crew and serves as a backup to the primary display. Pages are selectable using the EICAS control panel and includes many types of sys tem information, for example:
- hydraulic systems pressure
- flying controls position
- cargo bay temperature
- brake temperatures
- tire pressures
The information on the aircraft system data buses is routed to both EICAS displays and both multifunction displays. A data concentrator unit (DCU) receives data in various formats from a variety of sensors, including the high- and low-speed ARINC 429 bus, from analogue and discrete inputs from the engines and other aircraft systems. In the event of a display system failure, the other system displays essential information in a compacted format. Primary engine indications are as before, secondary indications are digital readings only. In the event that both systems fail, a standby LED display is used for EPR, N1 and EGT.
5.2 Ecam
This is a flight-phase-related architecture; displays are automatically selected for:
- pre-flight
- take-off
- climb
- cruise
- descent
- approach
To illustrate ECAM features, during the pre-flight phase, checklists are displayed on the left-hand screen; this includes information such as brake temperatures, APU status and advisory messages. During the pre-flight checks, the right-hand display provides a graphic representation of the aircraft, e.g. if doors are open or closed. The system automatically changes to the relevant pages needed for the next flight phase.
System warnings are prioritized, ranging from level one to level three; the warning hierarchy is similar to EICAS.
Both EICAS and ECAM reduce flight deck clutter by integrating the many electro-mechanical instruments that previously monitored engine and aircraft systems. Reliability is increased, and the pilot work load is reduced. Further information on ECAM is given in Section 13.
6. QUIZ--Multiple choice questions
1. HEIUs can remain charged for several:
(a) seconds
(b) minutes
(c) hours.
2. Ground idle speed occurs when the engine has:
(a) stabilized (slightly above self-sustaining speed)
(b) stabilized (slightly below self-sustaining speed)
(c) just been started.
3. Power from an engine is derived from measuring:
(a) torque and speed
(b) temperature and speed
(c) engine pressure ratio (EPR).
4. When lube oil operates at high temperatures, its viscosity:
(a) reduces and its lubrication performance decreases
(b) reduces and its lubrication performance increases
(c) increases and its lubrication performance increases.
5. The starting sequence for a gas turbine engine is to:
(a) turn on the ignition, develop sufficient airflow to compress the air, and then open the fuel valves
(b) develop sufficient airflow to compress the air, open the fuel valves and then turn on the ignition
(c) develop sufficient airflow to compress the air, turn on the ignition and then open the fuel valves.
6. EICAS warning messages are:
(a) red, accompanied by an audio alert (prompt action is required by the crew)
(b) yellow, accompanied by an audio alert (timely action is required by the crew)
(c) yellow, no audio alert (time available attention is required by the crew).
7. Engine pressure ratio (EPR) is used to measure a gas turbine engine's:
(a) torque
(b) thrust
(c) temperature.
8. Low-, intermediate- and high-pressure shafts are also referred to as:
(a) N1, N2 and N3
(b) N2, N3 and N1
(c) N3, N1 and N2.
9. Typical units of fuel mass flow are given in:
(a) pounds or kilograms per hour
(b) gallons per hour
(c) liters per hour.
10. A gas turbine engine's self-sustaining speed is when sufficient energy is being developed by the engine to provide continuous operation:
(a) with the starting device still engaged
(b) with the ignition system in operation
(c) without the starting device and ignition.
11. Referring to FIG. 33, this transducer measures:
(a) speed
(b) torque
(c) linear displacement
============
FIG. 33 See Question 11
Permanent magnet; Toothed wheels shown aligned (no load); No.2 coil NS No.1 coil; Magnetic flux; Turbine shaft
============
12. In turboprop engines, power is measured from:
(a) engine pressure ratio
(b) torque
(c) torque _ speed