AMAZON multi-meters discounts AMAZON oscilloscope discounts
PURPOSE AND BACKGROUND
The purpose of this experiment is to demonstrate the characteristics of three different diode rectifier circuits: half-wave rectifier, center- tapped full-wave rectifier, and full-wave bridge rectifier. Each type causes an ac input voltage to be converted into a pulsed waveform having an average, or dc, voltage output.
==
REQUIRED PARTS AND EQUIPMENT
- 1-kOhm resistor, 1/2 W
- Four 1N4001 silicon rectifier diodes
- 12.6-V rms secondary center-tapped transformer
- Dual trace oscilloscope
- VOM or DMM
- Breadboarding socket
==
USEFUL FORMULAS
Half-wave rectifier
(1) dc voltage output = V — VB (sine wave input)
(2) Diode PIV =
(3) Output frequency = input frequency
Center-tapped full-wave rectifier
(4). dc voltage output =. (sine wave input)
(5). Diode PIV —2V
(6) Output frequency = 2 x input frequency
Full-wave bridge rectifier
(7). dc voltage output =. (sine wave input)
(8) Diode PIV = Vp
(9) Output frequency = 2 x input frequency
PROCEDURE
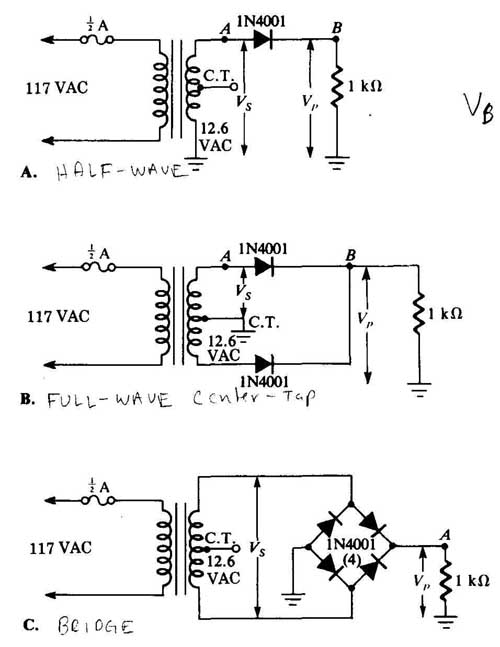
1. Wire the half-wave rectifier circuit shown in Figure 2—1A, paying careful attention to the polarity of the 1N4001 diode. You should be very careful to be sure that your connections to the 117-V primary of the transformer are properly protected so that you will not get a shock by accidentally touching them. Furthermore, you should have a 1/2-A fuse on the primary side of the trans former. Note that neither of the transformer’s primary leads is grounded, while the center-tapped secondary lead is not used in this section!
2. Set your oscilloscope to the following approximate settings:
Channels 1 and 2: 10 V/division, dc coupling
Time base: 5 ms/division
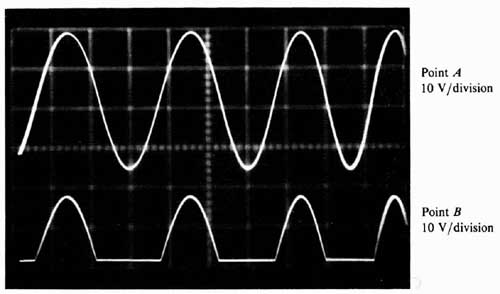
Apply 117 VAC (rms) to the transformer’s primary leads. Connect one scope probe to the anode terminal of the 1N4001 diode (point A), and the other probe to the diode’s cathode terminal (point B). If everything is working properly, you should obtain the waveforms shown in Figure 2—2.
3. Measure the transformer’s peak secondary voltage (Vs), as well as the peak voltage (VP) across the 1-kOhm resistor, recording your results . Are the two readings the same?

FIGURE 2—1 Schematic diagram of circuits.
You should find that these two readings differ slightly. The voltage difference is the barrier potential of the diode (VB), which is approximately 0.7 V for silicon diodes. When the peak voltage is at least ten times larger than this diode voltage drop, the barrier potential usually can be safely neglected, so that these two readings can be considered essentially the same.
4. With your VOM or DMM, measure the dc voltage (VDC) across the 1-kOhm resistor, and record your result. Compare this result with that obtained from the equation for the average or dc voltage of a half-wave rectifier (Equation 1).
Observe both waveforms. Notice that the frequency of the rectified output sine wave is the same as that of the input sine wave, even though half of each cycle of the output is zero. Why?
5. Turn off the power to the transformer, and wire the center tapped full-wave rectifier circuit shown in Figure 2—1B. Again, pay careful attention to the polarity of both diodes and the connections to the 117-V primary of the transformer. The center-tapped lead is grounded for this section.

FIGURE 2—2 Time base: 5 ms/division.
6. Now set your oscilloscope to the following approximate settings:
Channels 1 and 2: 5 V/division, dc coupling
Time base: 5 ms/division
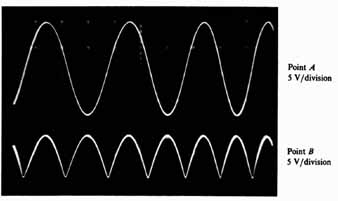
Apply 117 VAC (rms) to the transformer’s primary leads. Connect one probe to the anode terminal of the 1N4001 diode (point A), and the other probe to one of the diode’s cathode terminals (point B). If everything is working properly, you should obtain the waveforms as shown in Figure 2—3.
7. Measure the transformer’s peak secondary voltage (Vs) with respect to the grounded center tap, as well as the peak voltage (Vp) across the 1-kOhm. resistor, recording your results. How do-these readings compare with those of Step 3? The peak secondary voltage should be half that of Step 3.
8. With your VOM or DMM, measure the dc voltage (VDC) across the 1-kOhm resistor, and record your result. Compare this result with that obtained from the equation for the average or dc voltage of a center-tapped full-wave rectifier (Equation 4).
Observe both waveforms. Notice that the frequency of the rectified output sine wave is now twice that of the input sine wave. Why?
9. Turn off the power to the transformer, and wire the full-wave bridge rectifier circuit shown in Figure 2—1C. Pay careful attention to the polarity of all four diodes and the connections to the 117-V primary of the transformer. The center-tapped lead is not used for this section. Remove the oscilloscope probe from the anode of the diode.

FIGURE 2—3: Time base: 5 ms/division
10. Apply 117 VAC (rms) to the transformer’s primary leads. With the channel set to dc coupling, connect only the probe to the ungrounded lead of the 1-kOhm resistor (point A). If everything is working properly, you should obtain the same full-wave rectified waveform obtained in Step 6.
11. Measure the peak voltage (Vp) across the 1-kOhm resistor, recording your result. How does this reading for V compare with those of Steps 3 and 7?
The peak secondary voltage should the same as that of Step 3 and twice that of Step 7. In addition, you should find that the peak voltage across the 1-kOhm resistor is smaller than the secondary voltage by twice the barrier potential. Why?
12. With your VOM or DMM, measure the dc voltage (V) across the 1-kOhm resistor, and record your result. Compare this result with that obtained from the equation for the average or dc voltage of a full-wave bridge rectifier (Equation 7).
Observe both waveforms. Notice that the frequency of the rectified output sine wave is twice that of the input sine wave. Why?
WHAT YOU HAVE DONE
This experiment compared the output characteristics of three types of rectifier circuits: half-wave rectifier, full-wave rectifier using a center-tapped transformer secondary, and a full-wave bridge rectifier. Each converts an ac voltage into a pulsed waveform having an average or dc voltage output.