AMAZON multi-meters discounts AMAZON oscilloscope discounts
All structures have natural frequencies of vibration at which exciting forces become amplified. This amplification occurs when the excitation frequency coincides with the natural frequency in a condition called resonance. With variable-speed drives, many exciting frequencies change with motor speed and will result in resonance each time they cross a natural frequency. The strength of the resonance varies with the excitation amplitude and proximity to the natural frequency, as well as with the damping, mass, and stiffness associated with the natural frequency. ill 9.36 illustrates the relationships of these variables.
Resonances often vary erratically and seem to randomly appear and disappear.
Under certain conditions, the resonance will grow over a period of minutes and cause a sirenlike pure tone. ill 9.37 includes a motor sound spectrum with as much as 99 percent of the total sound contained within a 24-Hz band. Increasing the end-cap thickness reduced the amplitude somewhat and increased the frequency, but did not eliminate the pure tone. Cutting variable stiffness pockets in the thicker end cap caused the end cap to ripple at different frequencies and spread the resonance noise over a band of 300 to 400 Hz (see ill. 9.38). However, reduced pure tones still appeared sporadically and required further structural changes for suitable control. Since this type of noise problem occurs seemingly at random and varies radically from motor to motor, field noise complaints often seem unpredictable and , in some motors, defy verification.
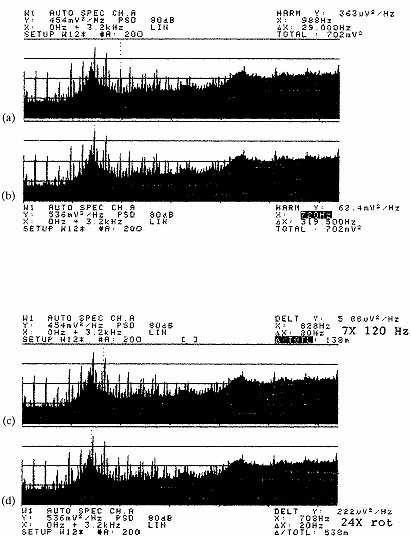
Ill. 9.34 Noise caused by improper stator bonding: ( a) x =
998 Hz, Δx = 29.000 Hz, ( b), x = 720 Hz,
Δx = 319.500 Hz, ( c) 7 times rotational, 120 Hz, x =
828 Hz, Δx = 20 Hz, and ( d) 24 times rotational, x =
708 Hz, Δx = 20 Hz. Modal analysis offers a method of experimentally
determining the type of movement, or mode of vibration, associated with
a natural frequency. ill 9.39 includes an animation of the mode previously
described, where the end cap vibrates axially like the bottom of an oil
can. This natural frequency can easily dominate the sound produced by a
motor, because the radial stiffness typically exceeds axial stiffness by
an order of magnitude. The proximity of the bearing to this natural frequency
can greatly amplify the noise of an otherwise acceptable bearing. Efforts
to control this noise by tightening bearing vibration requirements will
usually result in much higher bearing costs. However, adjustments to the
casting design prior to tooling could easily reduce the amplification of
the natural frequency enough to avoid bearing changes, with little or no
effect on casting cost.
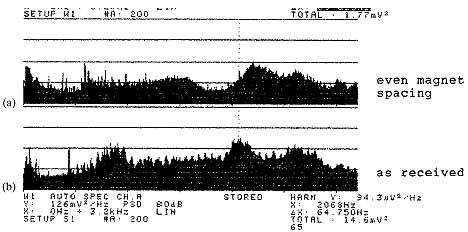
Ill. 9.35 Noise spectra of a brushless dc motor: ( a)
even magnet spacing, Δx = 65.625 Hz, and ( b) as received,
Δx = 64.750 Hz.
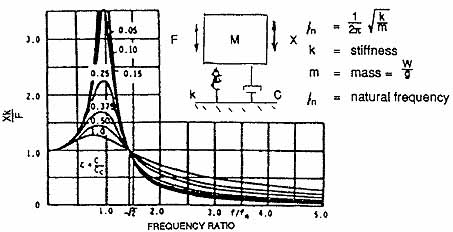
Ill. 9.36 Amplification of vibration at resonance.
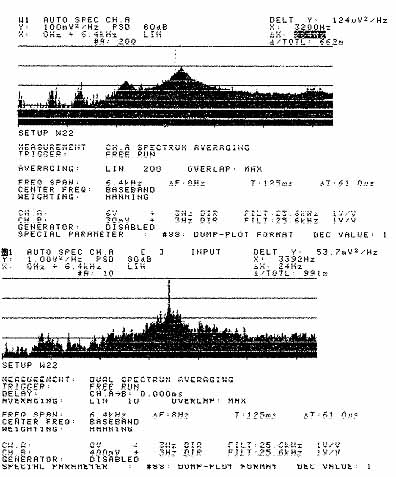
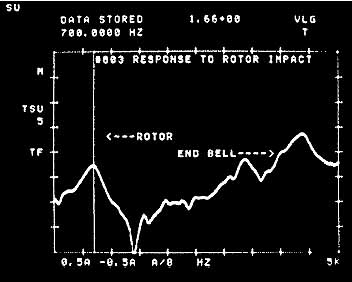
Modal analysis generally begins by exciting the structure with a shaker
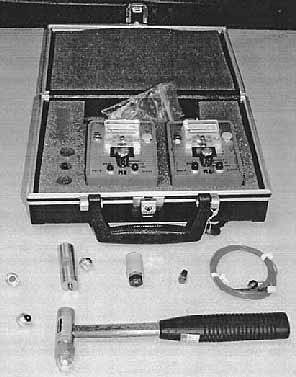
or, more commonly, an impact hammer. A typical impact hammer, shown in
ill. 9.40, includes a force transducer to measure the applied force and a modally tuned handle to avoid contaminating data with handle natural
frequencies. An accelerometer (often triaxial) measures the response at
predetermined locations on the structure, and a spectrum analyzer ratios
the force and response to produce frequency response functions (FRFs),
as shown in ill. 9.41. At this point, modal analysis software uses the
FRF and geometry information to determine the various modes of vibration,
including their frequency, damping, amplitude, and phase. This information
allows empirical confirmation of finite element analysis predictions of
natural frequencies made during the design process and minimizes the number
of prototype iterations required to optimize the structure.
Ill. 9.37 Spectrum of sirenlike tone, delta x =
264 Hz. Ill. 9.38 Spectrum of sporadic pure tone, delta x =
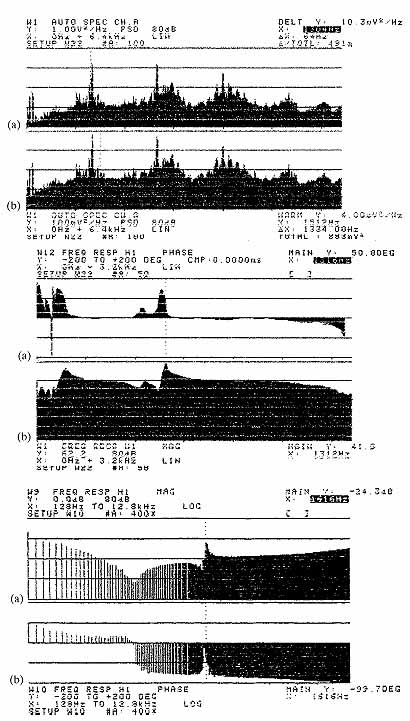
24 Hz. ill 9.42 illustrates the sound spectrum of a motor with 94 percent
of the total noise resulting from a shaft-bending resonance. The 1334-Hz
harmonics resulted from the clipped sine wave caused by the bearing clearance
truncating the shaft movement that normally would result from this resonance.
The resonance noise varied drastically in amplitude and often disappeared,
seemingly at random, for long periods. The lack of higher-order shaft-bending
resonances in the FRF in ill. 9.43 reemphasizes that the 1334-Hz harmonics
derived from signal distortion and not higher-frequency bending resonances.
This type of resonance often does not show up after assembly into the customer
unit because of the mass and stiffness additions. While increased shaft
stiffness will usually resolve this problem, added damping often provides
a more practical solution in small motors.
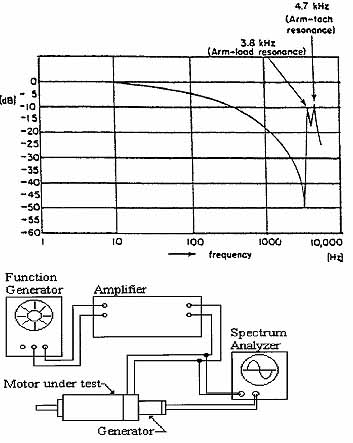
Motors with tachometer armatures assembled to the same shaft have a torsional natural frequency between the motor armature inertia and the tachometer armature inertia. The FRF in ill. 9.44 illustrates a 1232-Hz torsional resonance on a motor with a high-gain controller. This closed-loop system remained stable under low gain but be-came unstable under high gains because of the torsional oscillation amplified by the resonance. An increased joint stiffness solved the problem by reducing the amplitude and increasing the frequency, as shown in ill. 9.45. Further improvements, as revealed in ill. 9.46, resulted from an increased shaft stiffness that provided more than enough margin for manufacturing variations. ill 9.47 includes a Bode plot of the same type of motor with a load inertia added to the shaft extension. Similar techniques apply to the control of this additional potential resonance. ill 9.48 shows a frequency response test setup.
Customers sometimes encounter noise and vibration issues that relate to isolators or other components in their unit that go into resonance. In many cases, customers will perceive these systems issues as motor problems. Although the motor contributes to the total system as a component, motor changes often won't significantly affect this type of problem or will cost far more than addressing the main contributor. In these instances, the motor manufacturer may choose to identify the system problem through system testing in order to preserve a long-term relation-ship.
This testing usually consists of acoustic or vibration spectral analysis, followed by surveys of system natural frequencies with an impact hammer or shaker test.
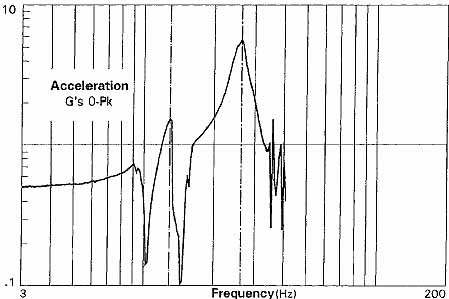
ill 9.49 includes a swept sine wave test performed by a shaker on a unit with typical isolators. After mounting the unit solidly to the shaker, a constant 0. 5g sine wave excitation began at the lowest frequency of interest and increased uniformly to the highest frequency under investigation. Many isolators include two or three frequencies that result in significant vibration amplification. Furthermore, these high levels can produce not only noise problems, but also physical damage to the motor, the unit, or the product in the unit.
Ill. 9.39 Model animation analysis of a motor (shaft vertical), showing axial oil-canning of the head (end cap) at the frequency of the high-frequency spike.
Ill. 9.40 Impact hammer.
Ill. 9.41 Frequency response function of impact hammer.
Ill. 9.42 Sound spectra of shaft-bending resonance: ( a) x = 1304 Hz, and ( b) x = 1334.00 Hz. Ill. 9.43 Frequency response functions of shaft-bending resonance: ( a) x = 1316 Hz, and ( b) x = 1312 Hz. Ill. 9.44 Frequency response functions of torsional resonance of armature and tachometer: ( a) x = 1616 Hz, and ( b) x = 1616 Hz.
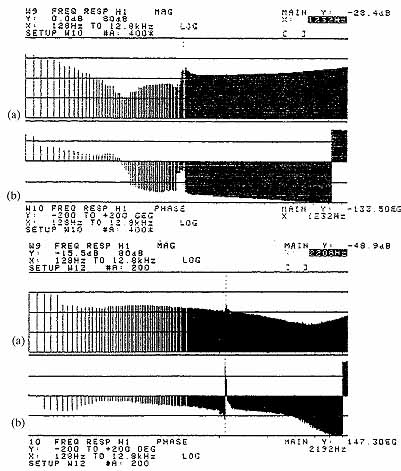
Ill. 9.45 Frequency response functions of unit with
increased joint stiffness: ( a) x = 1232 Hz, and ( b) x =
1232 Hz. Ill. 9.46 Frequency response functions of
unit with enough additional stiffness to accommodate manufacturing tolerances:
( a) x = 2208 Hz, and ( b) x = 2192 Hz.
The vibration spectra in ill. 9.50 illustrate a centrifuge with and without mount resonance modulation. The isolation mounts included three different natural frequencies with amplification factors often exceeding 10 to 1. As exciting frequencies from the variable-speed drive crossed these natural frequencies, the mount would go into resonance and create a sub-synchronous wave within the liquid in the bowl. The rotational speed of this wave equaled the drive speed minus the natural frequency of the mount. At certain centrifuge speeds, this wave would tear apart the blood cells and destroy the product. The intended use of this centrifuge for operating rooms made high reliability and performance essential. The customer thought the problem resulted from differences between prototype and production motors. Spectral analysis and shaker tests provided an objective way of identifying the problem and minimizing the controversy that often prevails with this kind of problem. The customers then fine-tuned their mount and changed their software to quickly take the centrifuge through dangerous speed ranges before the resonance could build to damaging levels. Shipping vibration can also excite these low-frequency isolator resonances, leading to fretting in clearance fits, false brinells in ball bearings, and destroyed optical encoders. In many cases, isolators require shipping restraints to avoid this kind of damage. Qualification shaker tests of packaging and products can prevent major field problems with new products or with changes to old products that affect these natural frequencies.
Ill. 9.47 Bode plot of motor with load inertia added. Ill. 9.48 Frequency response test setup.
Ill. 9.49 Swept sine wave test.
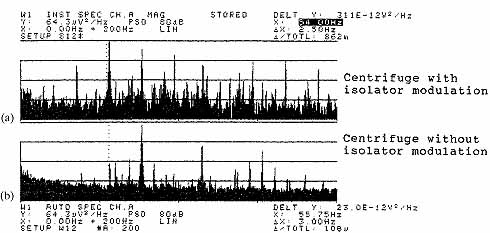
Ill. 9.50
Spectra of centrifuge: ( a) centrifuge
with isolator modulation, x = 54.00 Hz, and ( b) centrifuge
without isolator modulation, x = 55.75 Hz.