AMAZON multi-meters discounts AMAZON oscilloscope discounts
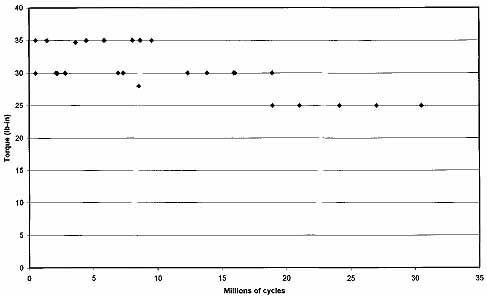
A typical shaft fatigue test consists of motors mounted to shelves with weights hung on steel shafts to produce a bending fatigue condition similar to a rotating beam machine. In ill. 9.51, the right motor has a hanger bearing and a weight positioned at a calculated distance to provide the necessary shaft stress without exceeding bearing fatigue limits during the test. Different distances and weights will provide a bearing fatigue or grease test without overstressing the shaft. The recorded data for shaft fatigue includes the number of cycles at each bending stress level and the measured shaft geometry. Shafts which don't fail, after a sufficient number of cycles, to reach the plateau of the S/N curve (usually between 10 8 and 10 9 cycles) will repeat the test at a load increased by a uniform increment of about one to two standard deviations until a failure occurs. Following statistical analysis, the S/N diagram in ill. 9.52 derived from the data collected from this type of test. For convenience, this chart uses inch-pounds of bending rather than actual stress.
Linear regression and exponential distribution show poor correlation because of data scatter. However, the mean and three-sigma limits for points in the region of the plateau yield a reasonable endurance limit in agreement with linear regression. After adjusting individual points for geometry variation, allowing for differences between test specimen strength and minimum specified strength, compensating for data scatter, and applying an appropriate factor of safety, these data provided a safe design limit for this material. Given this correlation, fatigue calculations can adjust for design variations and still provide good confidence in the results. Major advantages of this test procedure over photo elastic or normal rotating beam tests include empirical confirmation of notch sensitivity factors, surface factors, size factors, and various process effects such as residual stresses and plating.
Furthermore, this test method serves as much to validate the manufacturing process as the design and material. Seemingly minor process changes can produce significant changes in endurance limits.
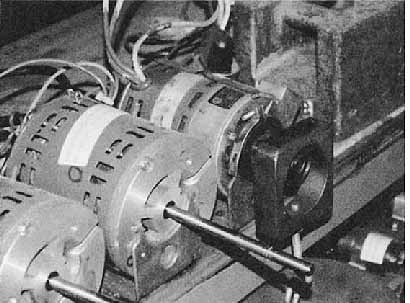
Ill. 9.51 Fatigue and lubrication tests.
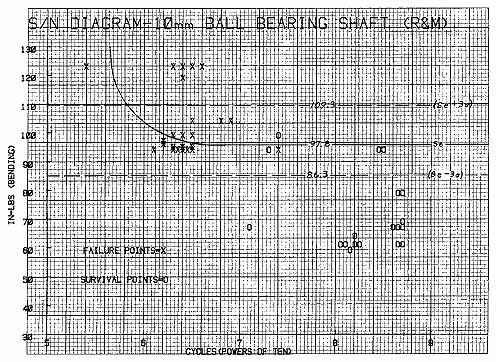
Ill. 9.52 Signal-to-noise diagram.
9.6.1 Gear Dynamic Load Tests
The cycling inertia test carts shown in ill. 9.53 maintain the same gear motor orientation as in the customer unit. Each pair of gear motors connects to a controller with a joystick and an interface box. The gearbox shaft supports an inertia wheel that simulates the worst-case inertia for the customer unit. A programmed controller sets the forward, reverse, acceleration, and braking levels to simulate the dynamic loads for severe field operation.
A programmable logic controller (PLC) provides a cycling relay closure between the common and the forward pin of the interface box for 7.5 s, and between the common and the reverse pin for the next 7.5 s. The PLC sequencing maintains 1.25 s of separation between each acceleration current spike to avoid affecting other motor pairs from spike overlap.
Two 100-A supplies feed each cart (at least three times the required capacity) to avoid limiting the controllers. A current probe and digital oscilloscope provide plots of current spikes for each motor at the beginning of the tests. A surveillance camera and time-elapse VCR record the failure time and date for each gear motor.
9.6.2 Constant Load Gear Tests
The gear motor in ill. 9.54 drives a magnetic brake at the rated load for most of a day and automatically shuts down. After a cooling period, the motor restarts at an intermittent-duty load and reduces to rated load after reaching the thermal duty limit. This setup will test for gear fatigue and lubrication life as well as for gearbox bearing and shaft fatigue. If necessary, the brake will apply multiple torque profiles for specific applications. This kind of testing proves especially useful in finding unexpected design or process weaknesses, while also helping to select lubricants and check fatigue limits.
Plastic materials, in general, don't have plateaus on their fatigue curves (as do most steels), but instead the safe fatigue limit falls continuously as their expected life increases (see ill. 9.55). For this reason, plastic gears will eventually fail from fatigue if run long enough. Steel gears, however, won't fail from fatigue in a clean environment if operated below a given endurance limit. Consequently, properly designed and operated steel gears will generally fail from wear, while properly designed plastic gears could fail either from wear or from fatigue when run beyond the design life. The possibility of continuous usage during the normal warranty therefore places more severe design requirements upon plastic gears than upon steel gears. In addition, fatigue tests require much longer test times for plastic than for steel.
Significant drops in fatigue strength often occur for molded plastic gears as compared to hobbed plastic gears. Consequently, molded gears usually need more face width than equivalent hobbed plastic gears. In many cases, assembly must also utilize ultrasonic techniques or double-D joints to overcome added stresses from post mold shrinkage and from reduced part stiffness caused by uniform wall thickness webbing.
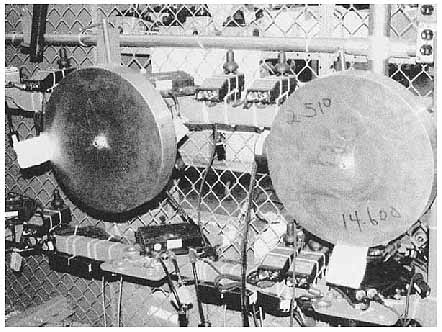
Ill. 9.53 Cycling inertia test charts.
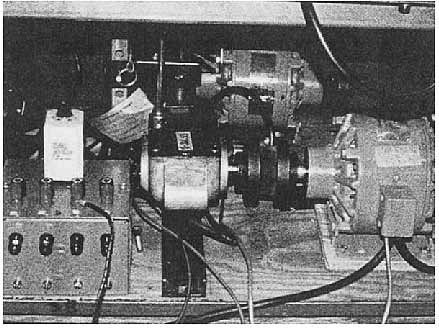
Ill. 9.54 Gear motor.
Ill. 9.55 Molded plastic gear fatigue.
9.6.3 Bearing Grease Tests
In most cases, grease and bearing manufacturers don't provide damping curves for particular greases. After measuring the bearing drag at different speeds and plotting the data, the damping constant equals the slope (usually in ounce-inches per 1000 rpm) and the friction equals the intercept point at zero speed (see ill. 9.56).This test especially affects grease selection for servo drives.
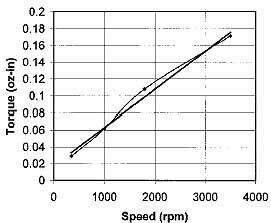
Ill. 9.56 Bearing grease torque test for bearing
0002-1695, 0.0002 to 0.0005 in clearance. Line with diamonds indicates
test 2, bearing 2; solid line indicates linear performance. y =
5E-0 5x + 0.0177; R 2 = 0.9899.
Continuous and cycling eccentric load tests will also compare greases for the ability to withstand vibration during operation, while also checking bearing support structures. This accelerated test often finds problems within days that may not reach failure in normal life tests for months or years. Although eccentric load tests won't replace long-term life tests, they significantly reduce product development time by quickly wringing out problems prior to lengthier tests.
Grease life tests at elevated temperatures provide a quick means of predicting application life based on the thermal stability of the grease. Although considerable industry data exists for older greases, the newer greases that offer major life advantages frequently don't have enough independent tests to overcome the variability common to this type of testing. Furthermore, the failure criteria for different tests may range from a 1 0 C increase in bearing temperature at the outer race to actual seizure, leading to widely different results. In many cases, a two- to three-month test can provide the high-temperature data necessary to proceed with confidence in grease selection. However, thermal performance of grease alone won't qualify a candidate for a specific application and serves strictly as a minimum requirement. Resistance to corrosion, operating and non-operating vibration, and other application-specific conditions can easily outweigh thermal stability in importance. Unfortunately, many customers don't know the exact conditions of their applications.