AMAZON multi-meters discounts AMAZON oscilloscope discounts
This section provides examples of the value of sound, vibration, and current spectral analysis for electric motors. Since spectral analysis encompasses a tremendous range of diverse technical areas, requiring many books to adequately cover, this section provides primarily hands-on snapshots of a few uses for motors. The Vibration Institute in Willowbrook , Illinois, offers a wide range of literature and training for those beginning in this field.
ill 9.14 illustrates a typical time signal, with time on the horizontal axis and amplitude (usually in volts) on the vertical axis. An oscilloscope commonly provides this type of display. After a fast Fourier transform (FFT), the horizontal axis changes to frequency, as shown in ill. 9.15. However, the basic analysis techniques remain the same, regardless of whether the electrical signal derives from sound, vibration, current, flux, surface finish, roundness, or any other parameter containing data of a periodic nature. For variable-speed motors, the waterfall display in ill. 9.16 simplifies the tracking of suspect frequencies with speed. Fixed frequency problems such as resonances and critical speeds stand out clearly as compared to speed-related problems.
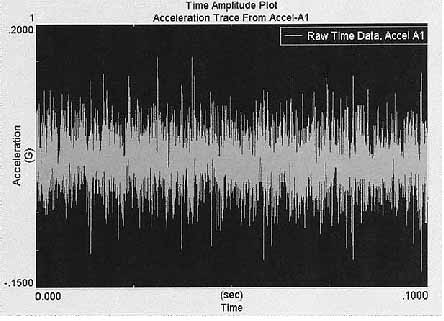
Ill. 9.14 Time history amplitude graph.
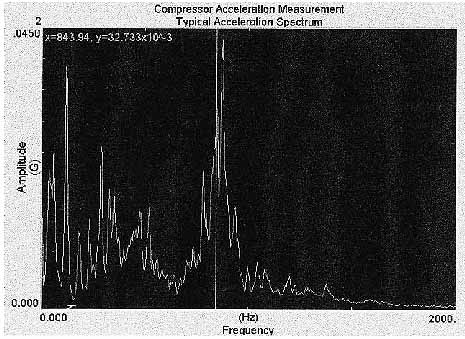
Ill. 9.15 Spectral amplitude graph.
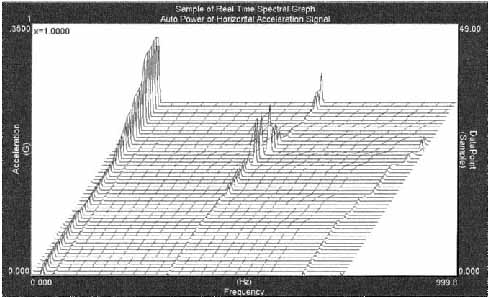
Ill. 9.16 Real-time waterfall display.
9.4.1 Ball Bearing Analysis
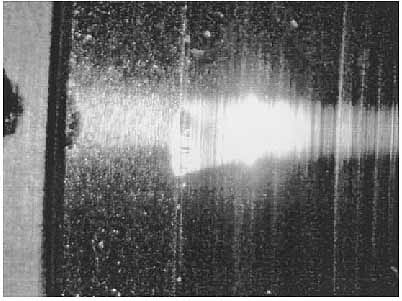
The spectrum in ill. 9.17 illustrates a motor with predominantly inner race and ball defect frequencies in the sound spectra. As shown in ill. 9.18, subsequent microscopic examination revealed false brinells on the side of the inner race closest to the rotor. Since the preload spring forces the balls toward the rotor, the inboard orientation suggests that the damage occurred following assembly. However, this type of mark results from extended periods of vibration on a non-operating bearing, such as might occur during shipment, but not during assembly. If at all possible, motors should ship with horizontal shafts to avoid exciting the axial rotor-spring resonance and to take advantage of the typically higher radial stiffness.
Ill. 9.17 Log power spectrum of bearing showing inner race and ball defects.
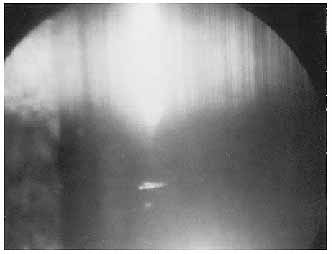
Ill. 9.18 False brinell on inner race of bearing.
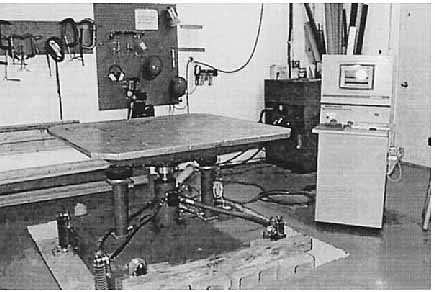
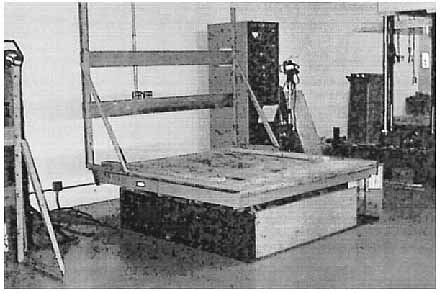
Ill. 9.19 Shaker table. Qualification of motor packaging
on shaker and oscillatory tables will prevent false brinelling from inadequate
packaging; Figs. 9.19 and 9.20 are examples of this equipment. Shock testing
will further qualify packaging to prevent housing distortion or true brinells
in bearings. Swept sine wave tests will reveal resonances in products or
packaging that shipping vibration could excite. Sine dwell tests at the
resonance points will then ensure that normal transportation vibration
wouldn't damage the product at these frequencies. Spectral analysis of
motors before and after testing will reveal damage by changes in bearing
frequencies or frequencies associated with other motor components that
produce periodic vibration.
Motors with true brinells tend to produce sound spectra with strong inner race and ball defect frequencies and lesser outer race defect frequencies. However, the nature of the defect will vary the contribution of each component and often will cause modulations that produce families of sidebands mingled with harmonics.
These sidebands can greatly complicate bearing spectral analysis, particularly when combined with large numbers of harmonics and sidebands from gears or other components.
The simple sound spectrum in ill. 9.21 includes mostly inner race harmonics generated by a severe true brinell as shown in ill. 9.22.
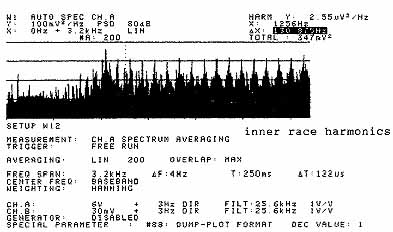
Ill. 9.21 Sound spectrum with inner race harmonics,
Δ x = 130.875 Hz.
Bearing contamination generally creates considerable white noise, combined with mixed bearing frequencies. E.g., the spectra in ill. 9.23 consist mainly of white noise with some inner race and ball defect harmonics. This bearing noise resulted from contamination denting (see ill. 9.24) caused by very fine paper dust contamination shown on the bearing housing in ill. 9.25. Harder particles such as graphite brush dust will produce larger denting until the bearing mills the particle size down. At this point, ball indentations will produce large numbers of transfer marks on the raceways. Because of the smaller race curvature lending less support at the point of contact, the inner race usually suffers more damage than the outer race.
Consequently, the ball and inner race defect frequencies tend to dominate the spectra and will often produce ball sidebands next to the ball harmonics, but separated by the difference between the ball and inner race frequencies. This type of spectrum (see ill. 9.26) almost always indicates hard particle contamination.
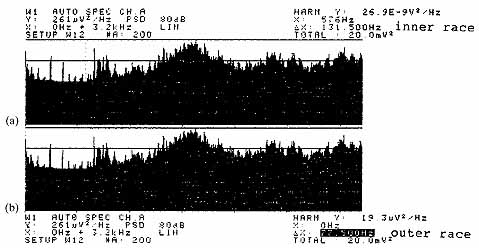
Ill. 9.23 Spectra consisting mainly of white noise
with some inner race and ball defect harmonics: ( a) inner race,
Δx = 131.500 Hz, and ( b) outer race, Δx =
77.500 Hz.
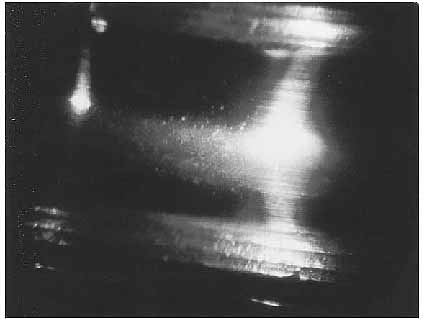
Ill. 9.24 Denting caused by contamination.
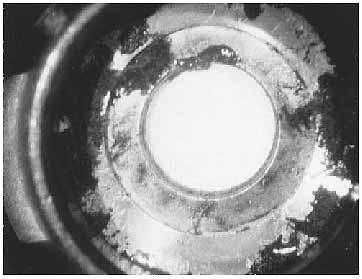
Ill. 9.25 Paper dust contamination shown on the bearing
housing.
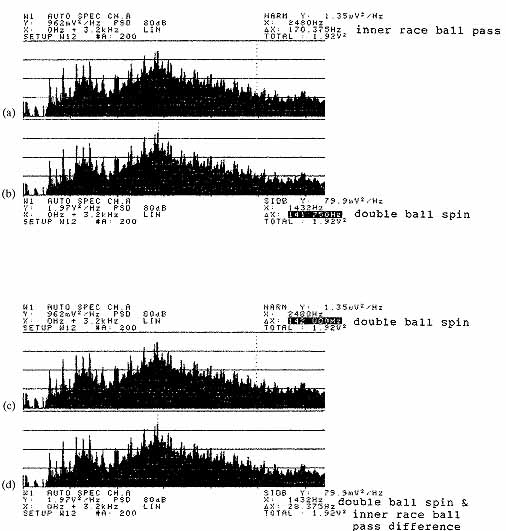
Ill. 9.26 Spectra indicating hard particle contamination: ( a)
inner race ball pass, Δx = 170.375 Hz, ( b) double
ball spin, .x = 141.750 Hz, ( c) double ball spin,
Δx = 142.000 Hz, and ( d) double ball spin and inner
race ball pass differential, Δx = 28.375 Hz.
Although the bearing defect frequency calculations in ill. 9.27 appear straight-forward, the presence of hundreds of intermingled harmonics, sidebands with unrelated carriers, and difference frequencies can greatly complicate analysis. In addition, field returns often generate bearing frequencies at variance with new bearings because of the effects of wear and slippage. The spectra in ill. 9.28 further demonstrate unexpected harmonics and sidebands resulting from unusual defects.
The ball bearings in an optical encoder had 15 out of 18 cage ball pockets rubbing on the shield, producing a mixture of cage harmonics and sidebands as well as a 15 times cage harmonics and sidebands. A change in internal shaft and housing shoulders solved the problem. Various unusual defects can take hours to diagnose, depending on the complexity of the product involved.
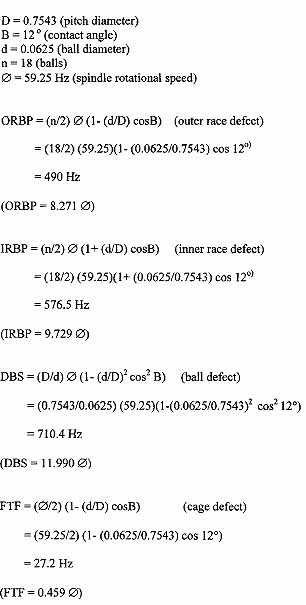
Ill. 9.27 Bearing defect frequency calculations.
9.4.2 Magnetic Noise
Even though ball bearing defects cause the most concern in noise issues, magnetic noise remains the dominant contributor to overall motor sound. For ac motors, varying the voltage provides the easiest method of separating magnetic and mechanical noise. Since magnetic sound varies roughly as the square of the voltage, cutting the voltage in half should reduce the total sound from 189 to 47mV^2, versus the actual result of 40 (see ill. 9.29). This indicates that magnetic noise constitutes well over 90 percent of the total noise from this motor. Further examination of stator and rotor harmonics reveals that rotor frequencies dominate the sound spectrum. The zoomed spectra in ill. 9.30 reveal slip frequency sidebands that confirm the diagnosis of rotor magnetic frequencies as the dominant contributor. These slip frequencies equal the number of poles times the induced rotor current frequency, which equals the synchronous speed minus the rotational speed.
Ill. 9.28 Unexpected harmonics and sidebands resulting from unusual defects: ( a) in-board bearing, 15 times cage harmonics, Δx = 408.5 Hz, ( b) outboard bearing, Δx = 407.5 Hz, ( c) 15 times cage sidebands, Δx = 106.6375 Hz, and ( d) cage sidebands, 27.1250 Hz. Efforts for noise reduction can focus on the exact contributors as opposed to trial-and-error methods. Furthermore, separation of mixed noises permits prioritization of methods to reduce noise and predictions of effectiveness. E.g., the spectra in ill. 9.31 consist of 80 percent gear pump pinion frequencies and less than 20 percent rotor magnetic frequencies. Even completely eliminating the motor noise wouldn't achieve the required customer unit noise reductions. These data allowed an objective means of negotiating the best methods of meeting the customer's sound target, while avoiding subjective arguments. In a similar vein, the spectra in ill. 9.32 contain mostly twice rotational speed harmonics resulting from misalignment introduced when a customer applied a third bearing to the motor shaft. The noise problem disappeared with the correction of the misalignment.
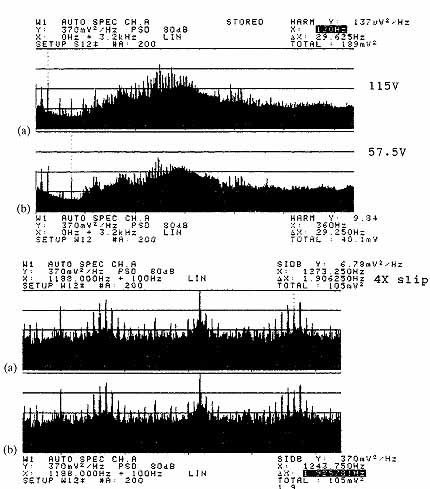
Ill. 9.29 Magnetic and mechanical noise: ( a)
115 V, x = 120 Hz, Δx = 29.625 Hz, and ( b)
57.5 V, x = 360 Hz, Δx = 29.250 Hz. Ill. 9.30 Zoomed spectra: ( a) 4 times
slip, x = 1273.250 Hz, Δx = 1.906250 Hz, and ( b) x =
1243.750 Hz, Δx = 1.925781 Hz.
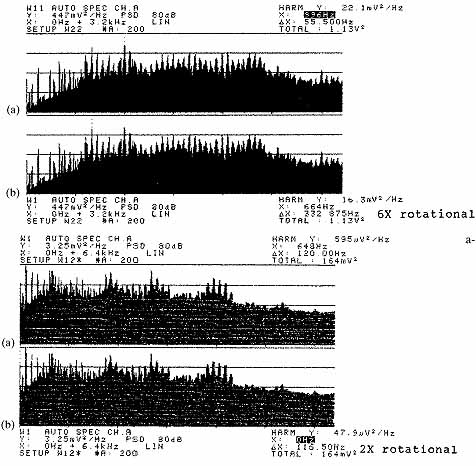
Ill. 9.31 Gear pump frequencies: ( a) x =
996 Hz, .x = 55.550 Hz, and ( b) 6 times rotational, x =
664 Hz, .x = 332.875 Hz. Ill. 9.32 Noise resulting from additional bearing: ( a) x =
648 Hz, .x = 120.00 Hz, and ( b) 2 times rotational, x =
0 Hz, Δx = 116.50 Hz.
Rotor magnetic vibration can cause fretting corrosion in oversize fits of the bearing to the casting. This process gradually increases the noise of motors in the field and can result in premature failure from loss of end play and excessive bearing loads caused by differential axial thermal expansion during operation. ill 9.33 includes a sound spectrum from a motor with fretting corrosion in the aluminum bearing housing. Additions of damping solved this problem less expensively than reducing the magnetic vibration directly.
Stator magnetic noise becomes more of an issue with intermittent-duty motors than with continuous-duty motors because of the higher flux densities. Improved lamination bonding can provide some reductions. In some cases, improper bonding can cause excessive noise, as illustrated in ill. 9.34.The 24 stator slots times rotational spike generated over half the noise from the motor, and other harmonics pushed this contribution to over 80 percent. Re-bonding the stator solved the problem.
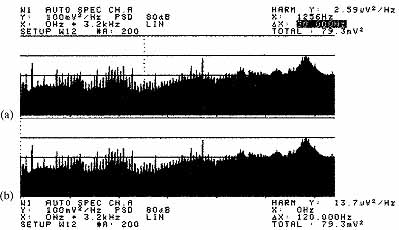
Ill. 9.33 Noise resulting from fretting collision: ( a) x =
1256 Hz, Δ x = 30.000 Hz, and ( b) x =
0 Hz, Δ x = 120.000 Hz.
Brushless dc motors eliminate the brush noise and much of the commutation noise produced by brush dc motors. However, magnet spacing becomes even more critical to quiet operation. The brushless dc motor sound in ill. 9.35 included a four-times rotational click caused by uneven magnet spacing. After tightening the production fixture and print, the new rotors nearly eliminated the clicking and solved the problem.
These case histories document a few of the ways in which spectral analysis can solve problems, improve customer relationships, and objectively deal with noise and vibration issues. Although spectral analysis can become a powerful tool within a company, attempts to improperly apply spectral analysis can very quickly turn it into a tremendous waste of time and resources.
