AMAZON multi-meters discounts AMAZON oscilloscope discounts
PURPOSE AND BACKGROUND
The purposes of this experiment are to demonstrate (1) the characteristics of a zener diode and (2) its use as a simple voltage regulator. Unlike rectifier diodes, zener diodes are normally reverse biased, so they maintain a constant voltage across their terminals over a specified range of current. Like a rectifier diode, a zener diode can be approximated by a constant dc voltage source in series with a resistor. When used as a regulator, the zener diode maintains a dc output voltage that is essentially constant even though the load current may vary.
REQUIRED PARTS AND EQUIPMENT
Resistors:
- 100 ohm, 1/4 W
- Two 220 C 1/2 W
1N753, 6.2-V, 400-mW zener diode
Signal generator
Two DMMs (preferred) or VOMs
Dual trace oscilloscope
Breadboarding socket
0-15 dc power supply
= = =
USEFUL FORMULAS
Maximum limiting series resistance
Output voltage
Zener diode power dissipation
Percent load regulation
Output ripple voltage
PROCEDURE
1. Wire the circuit shown in the schematic diagram of Figure 7-1A.
2. Increase the dc supply voltage in small steps while simultaneously measuring the voltage across (Vz) and the current through (Iz) the zener diode. In the vicinity of the zener’s knee voltage (approximately 6V), make these steps approximately 0.05 V. Do not exceed a zener current or 40 mA. Record your data, and plot your results for the corresponding zener current and voltage values on the graph provided for this purpose. What do you notice about the current-voltage curve for the zener diode?
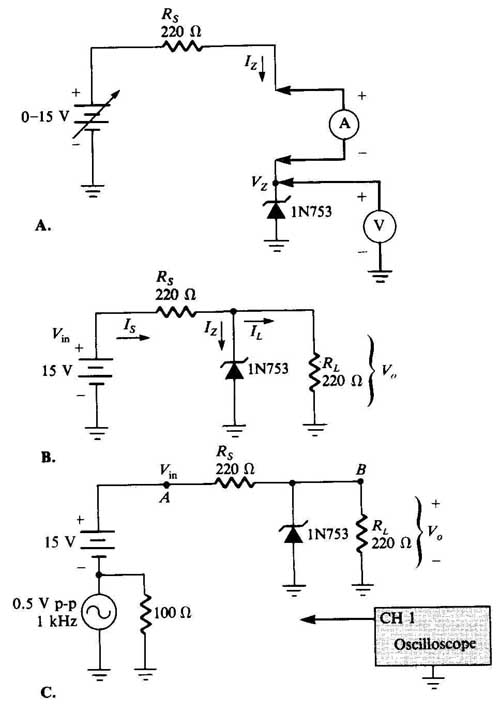
FIGURE 7-1 Schematic diagram of circuits.
Note that initially, the zener diode current is essentially zero for diode voltages less than the knee voltage. You should find that as the voltage drop approaches the diode’s knee volt age, the diode’s current increases rapidly, while, at the same time, the voltage stays essentially constant. Consequently, the zener diode maintains an essentially constant voltage drop when it is sufficiently reverse biased.
The 1N753 diode is rated at 6.2 V with a tolerance of 10%. From your graph, determine the voltage across the zener diode at a current of approximately 20 mA. Within 10%, your value should be 6.2 V.
3. Determine the internal resistance Rz of your 1N753 zener diode from your data by taking the change in zener voltage, Vz, divided by the corresponding change in current, delta Iz. Do this calculation only on the straight-line breakdown region of your diode curve that you plotted in Step 2. Record your result for the internal zener resistance in Table 7-1B.
4. Now wire the circuit shown in the schematic diagram of Figure 7-1B.
5. Apply dc voltage (Vin) to the breadboard. Measure the source current (Is), zener current (Iz), load current (IL), and full-load output voltage VFL, recording your values. Using e zener voltage and the internal zener resistance calculated in Steps 2 and 3, compare the measured output voltage with the expected value (Equation 3).
6. Now disconnect the 220-ohm load resistor. Measure the source current (Is), zener current (Iz), and output voltage with no load VNL, recording your values. Using the zener voltage and the internal zener resistance determined in Steps 2 and 3, compare the measured no-load output voltage with the expected value.
7. For this circuit, determine the percent load regulation, and record your result.
8. Now add a signal generator in series with the dc voltage source as shown in Figure 7—1C. Adjust the output of the signal generator at 0.5 V peak-to-peak with a frequency of 1 kHz.
9. With your oscilloscope at point A, observe both the dc and the ac voltage levels, using your oscilloscope set on dc coupling. You should see a 0.5 V peak-to-peak sine wave sine on a 15-V dc level above ground.
10. With your oscilloscope at point B, measure the dc output voltage of the zener diode regulator, recording your value. At this point you should see virtually no ripple voltage on the regulator’s output signal. How does this voltage compare with that measured in Step 5?
11. Now set your oscilloscope to ac coupling and increase its sensitivity to 5 mV/div. You should now observe a sine ripple signal, but now much smaller than the 500-mV input ripple voltage. Measure the output peak-to-peak ripple voltage and compare it with the expected value; record your results.
Notice that the zener diode regulator provides a relatively constant output voltage as long as the input voltage is greater than the zener’s knee voltage. If there is any voltage variation or ripple on the input voltage signal, the output remains essentially constant.
WHAT YOU HAVE DONE
This experiment demonstrated the characteristics of a 6.2-V zener diode. The zener diode is normally reverse biased so that it maintains a constant voltage between its anode and cathode terminals over a specified range of current. This experiment demonstrated the concept of voltage regulation where the output voltage remained essentially constant with changes in load current.