AMAZON multi-meters discounts AMAZON oscilloscope discounts
INTRODUCTION
A laboratory experiment, although a powerful learning tool in the educational process, is a double-edged sword. In order to receive the benefits it can provide, you must follow several rules so that your experiment will be successful. This section illustrates these rules and describes how each of the 43 experiments is presented.
BREADBOARDING
The breadboard is designed to accommodate the experiments that you will perform. The various transistors, diodes, integrated circuit devices, resistors, capacitors, and other components, as well as power and signal connections, all tie directly to the breadboard. Figure 1 shows the top view of the “solderless” breadboarding socket, which is manufactured or sold by several companies, including AP Products, Continental Specialties, and Radio Shack.
Breadboarding is an art that cannot be learned in a few minutes. Rather, it takes practice and experience to develop an efficient technique. An artist plans his creation, making sure that the picture will fit on the canvas in the proper proportions without crowding, and the same is true for breadboarding electronic circuits.
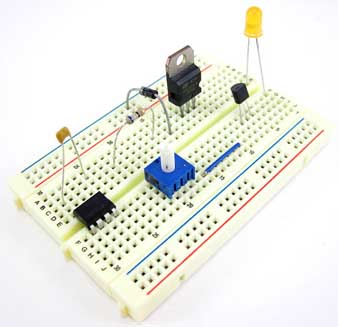
FIGURE 1
When breadboarding, keep the following rules in mind:
1. Only no. 22, 24, or 26 insulated wire should be used, and it must be solid, not stranded!
2. Never insert too large a wire or component lead into a bread- boarding terminal.
3. Never insert a bent wire. Straighten out the bent end with a pair of pliers before insertion.
4. Try to maintain an orderly arrangement of components and wires, keeping all connections as short as possible. Generally, the circuit is arranged on the breadboard in the same way that it appears on a schematic diagram. This rule is useful when you are trying to locate possible wiring errors.
RULES FOR SETTING UP THE EXPERIMENTS
Throughout this laboratory guide, you will have the opportunity to breadboard a variety of circuits. Before setting up any experiment, you should do the following:
1. Plan your experiment. Know what types of results you are expected to observe.
2. Disconnect, or turn off all power and external signal sources from the breadboard.
3. Clear the breadboard of all wires and components from previous experiments, unless instructed otherwise.
4. Check the wired-up circuit against the schematic diagram to make sure that it is correct.
5. Unless otherwise instructed, never make component or wiring changes on or to the breadboard with the power or external signal connections to the breadboard. This rule reduces the possibility of accidentally destroying electronic components and equipment.
6. When you have finished, make sure that you disconnect every thing before you clear the breadboard of wires and components.
FORMAT FOR THE EXPERIMENTS
The instructions for each experiment are presented in the following format:
1. Purpose and Background. The material under this heading states the purpose of the experiment. You should have this purpose in mind as you conduct the experiment. In addition, there is a short summary about the operation and characteristics of the circuit that you will be building.
2. Text Reference. The corresponding section number and title in Electronic Devices are given here (but you can use any textbook with a similar topic). These sections discuss the background for the experiment.
3. Required Parts and Equipment. A listing of the required circuit components and test equipment necessary for the experiment is given under this heading. Virtually all parts are low-cost and readily available from a variety of commercial sources, including local Radio Shack stores. (A list of the necessary components needed for all the experiments is given in the Addit. section; in most cases, each component also includes Radio Shack’s catalog number.)
Several pieces of equipment will be required for the experiments:
Oscilloscope. Just about any general-purpose type will do, and it should be a dual trace type. Input sensitivity generally ranges from 5 mV/division to 10 V/division and has a bandwidth from 5 MHz to 20 MHz. When needed, the schematic symbol of Figure 2 will be used.
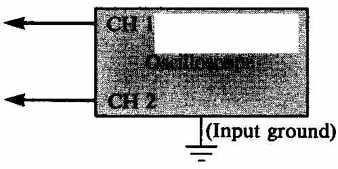
FIGURE 2
VOM, VTVM, or DMM. A general-purpose type capable of measuring dc and ac voltages and current, as well as resistance, is necessary. If you can obtain one, use a digital type; otherwise, any VOM used should have at least a 50 kOhm rating so as not to introduce serious loading errors.
Adjustable dc power supply. The dc power supply should have an adjustable output voltage range from 0 V to at least 15 V, with the capability of delivering 500 mA. Some experiments will require two power supplies.
Frequency counter. It need not be an expensive one, but it should have a resolution of 1 Hz for precise measurements. There are several units available in kit form for less than $80.
Function generator. A function generator is a signal source capable of producing selectable sine, triangle, and square wave forms of variable frequency and amplitude. Generally, they will have voltage levels from several millivolts to approximately 20 V peak-to-peak with an output impedance to 50 ohm over a frequency range from 1 Hz to 100 kHz. Also, there is usually a TTL level pulse output. When needed, the schematic symbol of Figure 3 will be used.
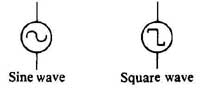
FIGURE 3 Sine wave; Square wave
4. Useful Formulas. Under this heading is a summary of the equations, when applicable, that apply to the design and operation of the circuit. These formulas are presented so that you can compare measured results with theory.
5. Procedure. First the following diagrams are presented:
Schematic diagram of circuit. This figure shows the completed circuit that you will wire up for the experiment. You should analyze this diagram in an effort to obtain an under standing of the circuit before you proceed. When used, the oscilloscope connections to the circuit are shown with bolder lines so that they will not be confused with the normal circuit.
Pin configuration. These configurations are given for all transistors and integrated circuit devices used in the experiment.
Next, a series of numbered, sequential steps gives detailed instructions for performing portions of the experiment. When appropriate, photographs of the oscilloscope’s display are included so that you will be able to compare your results. In addition, questions are included at appropriate points. Any numerical calculations are performed easily on many of the pocket-type calculators.
6. What You Have Done. Under this heading is an explanation of the main points gained in performing the experiment.
HELPFUL HINTS AND SUGGESTIONS
Besides the necessary parts and equipment, only three small hand tools are necessary for all of the experiments given in this guide:
1. A pair of long-nosed pliers
2. A wire stripper/cutter
3. A small screwdriver
The pliers are used to straighten out the bent ends of hookup wires that are used to wire the circuits on the breadboard. They are also used to straighten out or bend the resistor, capacitor, and other component leads to the proper position so that they can be conveniently inserted into the breadboard.
The wire stripper/cutter is used to cut the hookup wire to size and strip about 3/8 inch of insulation from each end.
The screwdriver can be used to remove the integrated-circuit devices from the solderless breadboarding socket by gently prying them loose.
In general, each experiment will ask you to compare a measured value with an expected value, that is, a value you would expect to obtain if you had not done the experiment. Generally, this value will be determined from theory To compare your experimental result with the predicted value, calculate the percent error, or percent difference. The formula for determining the percent error is:
% error = [measured value - true value]/ true value = x 100%
For example, if you measure a voltage of 5.36 V and you expect the value (from theory) to be 4.97 V, the percent error is:
% error = [5.36 — 4.97]/4.97 x 100% = 7.8%
The most common sources of error are the tolerance of component values and the loading effects of meters. The measured result is generally acceptable if the percent error is within 10%.
THE LABORATORY REPORT
As with any laboratory-oriented course, there is usually more to the laboratory exercise than merely performing the experiment. Performing the laboratory experiment should be followed by writing what was done in a technical report. As an educational exercise, writing the report serves two major purposes. First, a written re port documents what took place in the laboratory and gives the instructor an indication of how well the student has understood the principles and concepts that were supposed to be demonstrated by a particular experiment. Second, writing a technically oriented report provides the student with the practice of developing the communications skills that will be useful in his or her professional career. It is my experience that many students, even in standard courses in English composition, receive little or no instruction in writing technical material about their particular area of study.
Many instructors or departments may have their own guide lines and rules concerning the format of the laboratory report. Following is a brief discussion of the guidelines used in the Electrical and Electronics Technology program here at typical Technical and Community College.
The completed laboratory report may be either neatly hand written in ink (black or blue) or typewritten (Word or PDF document). The point here is that neatness and legibility are important. If the instructor cannot read a sloppily written or typed report, then the effort and time taken in its preparation has been wasted. In our courses, ample time (usually one week) is given from the date the experiment was performed until the report is due.
A report should contain the following elements:
1. Title. The title of the experiment at the beginning of the report should be a descriptive phrase that identifies the experiment. As an example, “The Common-Emitter Amplifier” is more descriptive than “Experiment 4” because it may not be apparent what the substance of Experiment 4 actually is. In addition, the name of the person submitting the report should be included, along with the names of other laboratory partners. Finally, the date the experiment was performed must be included.
2. Purpose or Objective. The particular experiment is to be performed for some definite reason. A brief statement (one to three sentences) that explains why the experiment is being performed is included.
3. Wiring (Schematic) Diagram. A schematic diagram of the circuit(s) used in the experiment must be included. The diagram must be neatly drawn and properly labeled with all component values used. The use of templates to draw electronic symbols is not mandatory, and the symbols can be drawn freehand. However, all connecting lines must be drawn with a straightedge.
4. Equipment and Special Supplies. The serial number and model number of the equipment used in the experiment should be recorded. In some cases, the student may be asked to re peat the experiment to show why unusual results have been obtained. In practice, faulty results may be obtained because of a faulty meter or other equipment, a fact the student can prove only if the exact instrument is used in the repeated experiment.
5. Procedure. This contains short comments in chronological order about the measurements, instruments used, and any special techniques used. Such comments are usually sufficient to explain what was done during the experiment. Long explanations are generally not necessary and usually not desirable. The comments nevertheless should be complete enough to al low another person to perform the experiment for verification.
6. Data Tables. In almost all experiments, a number of measured values should be recorded in ink. Charts are the most convenient method of recording these data, since all values are readily available for analysis. The data sheet on the perforated page at the end of each experiment in this laboratory guide serves as the format for the data table.
The student should also understand that all erasures and changes in data are observed by others with great suspicion. Recording errors should not be erased. They should be indicated as errors by drawing a single line through the incorrect data and writing the correct value beside it. Many industrial firms also require that the employee initial the change along with the date. Indicating the error by the single-line method retains the original measurement for future analysis if it should be found to be important. In some experiments, the possible error is the only interesting part of the experiment, and the measurement would be completely lost if it were erased, scratched out, or otherwise defaced.
7. Calculations. All experiments require a certain number of calculations before final results are obtained. Sample calculations that are completely identified should be included. It is not necessary to show repeated calculations.
8. Graphs. Data that have been recorded in long columns on charts cannot be analyzed quickly, but the graph provides a visual, or pictorial, presentation of the data. The graph can be used to determine trends and unusual results, such as a data point that is probably in error.
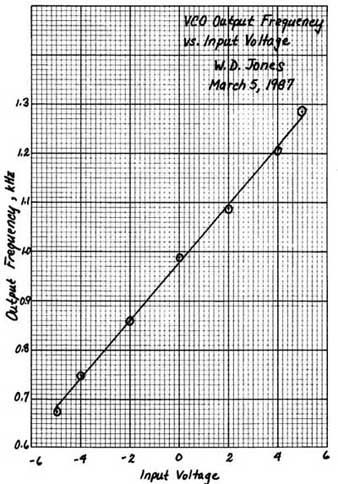
Figure 4: Hand-drawn graph.
The guidelines in constructing a graph are very simple:
• Always label the axes. Generally, one parameter is plotted as another parameter is varied. The dependent variable is represented on the vertical axis, and the independent vari able on the horizontal axis. If, for example, the gain of the amplifier is measured as the input frequency is changed, the amplifier gain is the dependent variable because its value depends on the value of the input frequency.
• All graphs should include a title, name of the preparer, and the date the graph was made. At some later time, this basic information pins down what the graph depicts, who did it, and when it was done.
• If various conditions plotted on the same graph result in more than one curve or line, the data points from one set of data should be easily distinguishable from data points belonging to a different set. Data points are frequently marked using a dot surrounded by a small circle, or A, +, * symbols.
• The data points should be connected smoothly with the best-fit straight line between all points, or with a “French curve” to construct a smooth curve between points. Figure 4 shows an example of a completed hand-drawn graph of the measured output frequency of an oscillator as the input voltage is varied.
9. Results and Conclusions. The results and conclusions are probably the most important part of the experiment. The en tire experiment is considered a failure if the student does not understand the results and cannot decide how to express the conclusion. Many instructors read this part of the report first and then refer to the first eight items for supporting information. The conclusion should be as brief as possible (less than one written page). Long conclusions often tend to bury the actual results of the experiment and instead become a procedure sheet. One statement that should be avoided is “Everything went well, as expected.”
10. Answers to Review Questions (optional). At the end of each experiment in the guide are several multiple-choice questions. Some instructors may want to have the student include the answers to these questions as part of the laboratory report.