AMAZON multi-meters discounts AMAZON oscilloscope discounts
<<<Cont. from prev.
10.4 Stator Condition
When discussing the stator, we are referencing the DC or three-phase AC windings, insulation between the turns of the winding, solder joints between the coils, and the stator core or laminations. This fault zone creates a lot of debate as to the cause and rate of failure. The stator fault zone is often considered one of the most controversial areas due to the significant challenge in early fault detection and the prevention of motor failure surrounding the stator windings. This challenge is further intensified in higher voltage machines, where the fault-to-failure time frame becomes much shorter. The stator fault zone is identified as the health and quality of the insulation between the turns and phases of the individual turns and coils inside the motor.
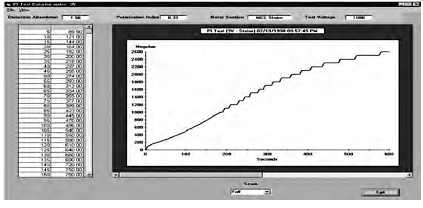
FIG 24 Graph showing insulation resistance readings of very dry or brittle
insulation. Sample result page from PdMA MCE.
Failure Mechanisms:
The likely mechanisms of a stator-winding fault are either a turn-to-turn, phase-to-phase, or turn-to-ground short. A turn-to-turn short is identified as a short of one or more windings in a coil. This can develop into a very low impedance loop of wire, which acts as a shorted secondary of a current transformer. This results in excessive current flow through the shorted loop, creating intense heat and insulation damage. Due to the nature of a random wound design, a shorted turn could occur with much higher impedance, allowing the motor to run for extended periods of time before eventually destroying the coil with the high currents. As a result, it is not unusual to find random wound motors still running with bad stator windings. Form wound coils however, do not exhibit high turn impedances and will there fore heat up quickly following the presence of a turn-to-turn short. A phase-to-phase short is identified as a short of one or more phases to another phase. This fault can be quite damaging due to the possibility of very large voltage potential existing between phases at the location of the short.
Analysis:
The big controversy, which surrounds the stator fault zone, is whether technology can give ample warning of an impending stator-winding failure.
A motor will develop a turn-to-turn, phase-to-phase, or ground short over its life. The goal of any test, when faced with this type of long-term certainty, is to identify the impending conditions, which may be conducive to these faults, so the condition can be corrected. If the conditions conducive to faults are removed, then a longer life for the motor can be expected. If a turn to-turn short has occurred, then preventing a restart of the motor may be the best thing at that point in the troubleshooting effort. Again, if you wait until the turn-to-turn short has occurred before you test the motor, you have waited too long.
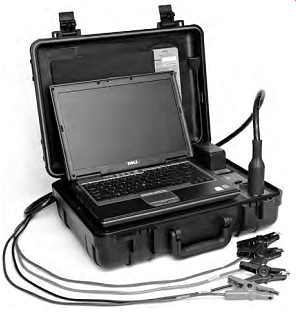
FIG 25 PdMA's MCE tester. MCE may be used to test all major types of
motors: induction, synchronous, wound rotor, DC, servo, and spindle.
A surge comparison test set, or PdMA's MCE test instrument, shown in FIG 25, applies a high-frequency AC signal and a low-voltage DC signal to the stator windings to perform stator analysis. From these signals, inductance and resistance measurements are taken for comparison between like coils and historical data. When testing a three-phase AC induction motor, comparison between the three phases is the most powerful tool. When testing a DC motor, only a single phase exists and comparison to historical test data or identical motors would be effective. Inductance is a highly sensitive parameter and is influenced by many variables within the motor. Rotor condition, air gap flux, frame construction (iron or aluminum), and winding condition are a few of the variables. The most influential variable on the inductance reading is the winding condition. Specifically the number of turns is a squared value in the overall inductance equation as seen below:
... where ...
L is the inductance (Henrys) N is the number of turns of coil m is the permeability of core in electromagnetic units A is the cross-sectional area of core (cm^2) l is the mean length of core (cm)
Although it is our goal to prevent a turn-to-turn short from occurring, you can see that a loss of a single turn in a stator winding will have a dramatic effect on the overall inductance of one or more phases based on the coil configuration. In our effort to identify the conditions that are conducive to a turn-to-turn short, we can use other variables in the equation to identify anomalies, which could create stator problems.
Stator faults often end up as a turn-to-turn short, but begin as something else. An example is a motor with excessive vibration, which results in winding movement, friction, and eventually worn insulation between the winding turns. Another example is rotor defects, which create intense heat on the winding surface and eventually create weakened turn insulation or even a ground fault. Core iron defects, such as shorted laminations, will also create additional heat, airflow disturbance, and elevated vibration due to imbalanced magnetic fields and air gap flux. What influence do these situations have on stator inductance? Other than vibration, rotor defects and air gap flux anomalies have a direct impact on the permeability ( m) of the stator windings. Changes in m due to a stator core defect will create changes in inductance related to a specific group of coils located near the defect. Changes in m due to rotor defects will have a varying influence on the stator inductance as the rotor position changes. A quick comparison of the inductance and inductive imbalance values between the three phases or to historical data will indicate changes in these variables and prompt further action or testing to be performed in an effort to prevent the turn-to-turn short.
Stator analysis may be performed by evaluating the phase relationship of voltage and current for each of the three phases of an AC induction motor.
These values are used to determine the impedance of each phase and display them as an impedance imbalance. Any change in the real or reactive component of one phase that is not duplicated on another phase will indicate a change that needs to be investigated. One of the hurdles involved in this type of testing is acquiring this dynamic data at a load substantial enough to allow these values to be affected by the condition of the windings and not the design. An unloaded motor may run with a current imbalance.
This creates variations in the phase impedance, which duplicates indications of a stator fault. Therefore, it is important to have approximately 70% load or more to remove the design impact on these values. Testing should not stop at <70% load, but you must use the test data as comparison values only.
A test today at 50%-60% load compared to a test last quarter at 50%-60% load is still a very informative test. The more test points are obtained, the more confidence there is in the condition of your stator windings.
Another application is the ability to acquire data on current through the start-up cycle of the motor. The motor is under the most stress during start-up and can give many indications of problems existing or developing.
Stator defects, as in open or shorted turns, will be identified as a change in the amplitude of the inrush current. The inrush current is the highest amplitude of current seen through a start-up and occurs immediately after the motor is energized. This occurs due to the effective locked rotor condition, which the motor is in at start-up. Without rotor movement, the counter electromotive force created by the rotor to reduce current flow in the stator does not exist. In fact, the inrush current immediately following the start of a motor is not affected by load at all. Whether at full load or no load during a start-up, the inrush current will be the same. Only line voltage and circuit impedance will have an effect on the inrush current. The current, which exists following the initial inrush however, is greatly affected by the load. If only line voltage and circuit impedance will affect the inrush current value and we generally expect line voltage to be the same, we must rely on circuit impedance as an indicator of stator health. Inrush current is dependent on impedance of the circuit therefore increased inrush current from normal indicates lower circuit impedance. Lower circuit impedance could be caused by weakened turn insulation or shorted turns and an open winding, high resistance connection or even incorrect repair specifications may cause higher circuit impedance.
If significant temperature variations occur from one test to another, it will have an impact on the overall circuit impedance. The effect of temperature should be considered when evaluating the start-up data including inrush current.
It is important to remember that stator defects do not exist very long before they can become catastrophic. Use all the tools available, know the circum stances, and act quickly to dismiss or confirm stator fault indications. The goal of stator analysis is to identify any condition that may lead to a turn to-turn short so that condition can be corrected before a turn-to-turn short occurs. If turn-to-turn shorts go undetected, then over time they will become bigger faults, such as coil-to-coil short, or phase-to phase short. Refer to Section 10.11.9 on surge comparison tests for detecting turn-to-turn shorts.
10.5 Rotor Condition
Rotor condition refers to the rotor bars, the rotor laminations, and the end rings of the rotor. In the 1980s, a joint effort between EPRI and General Electric showed that 10% of motor failures were due to the rotor. The rotor, although a small percentage of the motor problems, can influence other areas to fail.
Starting a motor with a broken or cracked rotor bar causes excessive heat to be generated around the vicinity of the broken bar. This can spread to other rotor bars and destroy the insulation around the nearby laminations. It can also affect other parts of the motor. What do we find just a few millimeters away from the rotor? It is the stator. Stator insulation cannot hold up to the intense heat developed by the broken rotor bar and will eventually fail. Unfortunately, many times broken rotor bars are not easily seen without testing and it may be missed as the root cause of failure. This may result in a motor rewind, and replacement of bearings, but not a rotor repair.
When the motor returns to service, it has the same problem all over again, just with new insulation to destroy.
The design of the rotor plays a major role in the severity of an identified rotor anomaly. If the rotor is a closed bar design, such as shown in FIG 26a, the severity will be low due to the rotor iron acting to hold the broken rotor bar in place. However, if the rotor is an open bar design, as shown in FIG 26b, then the severity increases significantly with the identification of a rotor defect. This elevated concern comes from the possibility of the rotor bar squeezing out of the rotor slot and contacting the stator.
The following tests may be performed to check the rotor.
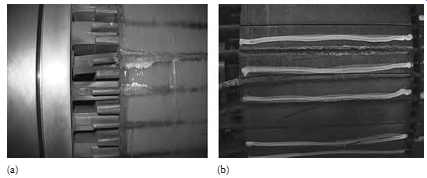
FIG 26 (a) Closed and (b) open bar rotor designs.
Rotor influence check:
One method of testing the rotor condition is the rotor influence check (RIC). What is a RIC? The RIC is a test performed on AC induction, synchronous, and wound-rotor motors, which illustrates the magnetic coupling between the rotor and stator. This relationship indicates the condition of the rotor and air gap within the motor.
The RIC is performed while rotating the rotor in specific increments (deter mined by the number of poles) over a single-pole group and recording the change in inductance measurements for each phase of a three-phase motor.
For proper resolution, 18 inductance measurements per pole group are recommended. To determine the number of poles in a motor use the following equation.
/120 FNP =
where
F is the line frequency N is the speed of the motor (rpm)
P is the number of poles Recalculated for 60 Hz: P = 7200/rpm Example: A motor with nameplate rpm = 1780 would have four poles as calculated from the above equation.
A RIC must be performed to provide any information about the standard squirrel-cage induction rotor. Faults such as broken rotor bars or damaged laminations can exist even if the balance of inductance is low. Basing the decision to perform a RIC only on how high the balance of inductance is on the baseline test could result in overlooking late stages of rotor bar defect.
FIG 27 shows the expected inductance changes for a rotor with broken rotor bars. Note the erratic inductance values at the peak of the sine waves for each phase. Broken rotor bars cause a skewing in the field flux generated by and around the rotor bars. A normal rotor would have no skewing or erratic inductance patterns, as seen in FIG 28.
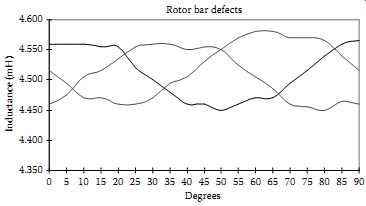
FIG 27 Graph showing expected inductance changes for a rotor with broken
rotor bars. Rotor bar defects, Inductance (mH), Degrees
Numerous methods exist for rotor evaluation with the motor running. These methods are inrush current time domain, spectral, and demodulated forms of the current signal which offer a broad approach to rotor analysis. Equipment from various manufacturers is available to perform such analysis.
Inrush/start-up:
One method of evaluating rotor health is the inrush/start-up. Broken rotor bars create higher rotor impedance resulting in higher reflected impedance onto the stator driving the current and torque down. This can be seen in the before and after inrush examples shown in FIG 29.
(Fp) sidebands
Another method is trending the pole pass sideband frequency (Fp) amplitude. Increasing Fp sideband amplitude is indicative of a modulating line current associated with rotor slip. This modulation is often due to a rotor cage anomaly. Trending the Fp sideband amplitude an determining the differential amplitude as compared to line frequency amplitude allow a predetermined alarm based on well-known industry accepted standards.
FIG 30 shows an elevated Fp sideband peak above the 36 dB differential from line frequency.
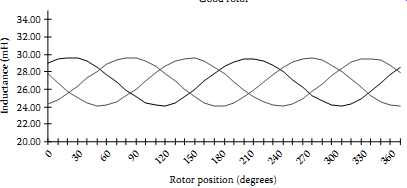 FIG 28 Graph of a good rotor showing no skewing or erratic inductance
patterns. Rotor position (degrees)
FIG 28 Graph of a good rotor showing no skewing or erratic inductance
patterns. Rotor position (degrees)
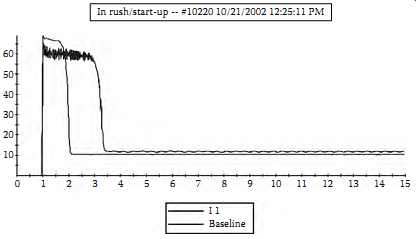 FIG 29 Graph showing inrush current of the motor relative to the baseline
inrush current.
FIG 29 Graph showing inrush current of the motor relative to the baseline
inrush current.
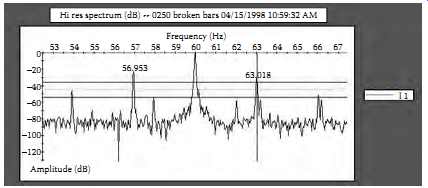
FIG 30 Graph showing an elevated Fp sideband peak.
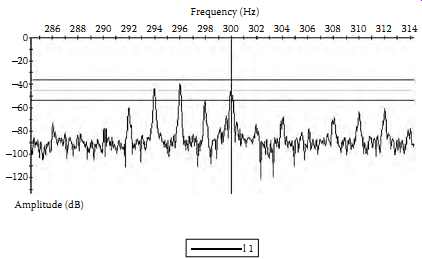
FIG 31 Graph showing elevated sidebands beneath the fifth harmonic.
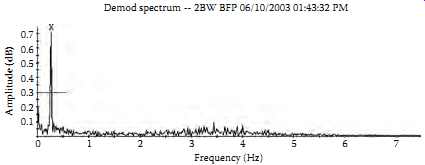
FIG 32 Graph showing the elevated Fp peak.
Fifth harmonic
The third method of evaluating rotor health is the high-frequency spectral analysis sometimes referred to as the Swirl effect. FIG 31 shows these elevated side bands beneath the fifth harmonic.
Current demodulation
The fourth method of evaluating rotor health is the demodulated current spectrum. By removing the components of line frequency from the spectrum, the noise floor drops to a value allowing normally nonvisible peaks to be visible. Relating to rotor health it also allows a filtered view of the Fp in a demodulated spectrum form. FIG 32 shows the elevated Fp peak exceeding a predetermined alarm set point. This peak was associated with a broken rotor bar in a large 2-pole motor.
In a study funded by the Electric Power Research Institute, 10% of motor failures were caused by a rotor anomaly. This amounts to a large number of motors in even the average-sized plant. It is important to be aware of the rotor design, utilize the broad spectrum of test methods discussed above to correlate and confirm, and extend the motor life by fixing the cause not the symptom.
10.6 Air Gap
This relationship references the air gap between the rotor and stator. If this air gap is not evenly distributed around the 360° of the motor, uneven magnetic fields can be produced. These magnetic imbalances can cause movement of the stator windings, resulting in winding failure, and electrically induced vibration, resulting in bearing failure.
The air gap fault zone describes the measurable distance between the rotor and stator within the motor. Air gap eccentricity is a condition that occurs when there is non-uniformity in the air gap between the rotor and stator.
When there is an eccentricity in the air gap, varying magnetic flux within the air gap will create imbalances in the current flow, which can be identified in the current spectrum. This unevenness in the space between the rotor and stator will affect the alignment of the RIC results.
Static eccentricity occurs when the centerline of the shaft is at a constant offset from the centerline of the stator. An example is a mis aligned end bell.
Dynamic eccentricity occurs when the centerline of the shaft is at a variable offset from the centerline of the stator, such as a wiped bearing.
Failure Mechanisms
By definition, air gap eccentricity is a mechanical fault with the motor.
There are several possible causes for the presence of variances in the distance between a rotor and a stator. The five basic types of air gap eccentricities that can occur are:
- Rotor OD is eccentric to the axis of rotation
- Stator bore is eccentric
- Rotor and stator are round, but do not have the same axis of rotation
- Rotor and shaft are round, but do not have the same axis of rotation
- Any combination of the above
The following are only a few of the possible causes of an air gap eccentricity:
Incorrect mounting of the motor to its bedplate can lead to an air gap distortion. A loose or missing bolt allows shifting of the motor's mounting foot during thermal expansion of the frame. This shifting over time could lead to a distortion of the frame and possible eccentricity of the stator. The common term for a motor incorrectly mounted is soft foot.
During construction of the motor, out-of-roundness of either the rotor or stator will lead to an air gap eccentricity. Industry standards recommend that measurements for total indicated roundness should be performed at different locations along the length of each of these components. Couple these measurements with the circumferences of each component, and depending on the speed and size of the motor, there are recommended tolerances from 5% to 20% variation in the air gap.
Eccentricity can develop due to incorrect tensioning of drive belts coupled to a motor. Incorrect alignment could also lead to a situation similar to this with both leading to a bowing of the rotor during operation.
Distorted end bells, cocked bearings, or a bent shaft will all cause an air gap eccentricity. During the manufacturing of the rotor, uneven mechanical stresses could be introduced into the cage and lamination stack leading to bowing of the completed rotor.
An air gap eccentricity results in increased levels of vibration due to the uneven magnetic pull it creates between the circumference of the rotor and stator bore. Over time, these elevated levels of vibration can result in excessive movement of the stator winding, which could lead to increased friction and eventually a turn-to-turn, coil-to-coil, or ground fault. Additionally, this vibration can accelerate bearing failure, which could seize the shaft and overheat the windings or allow additional movement of the shaft leading to a rotor/stator rub. The uneven magnetic stresses applied to the rotor coupled with the increased vibration will also contribute to mechanical looseness developing in the rotor. Any of these occurrences could lead to a catastrophic failure of the motor, which could require a complete rewind and possible restacking of the iron.
Analysis:
The easy part about analyzing a motor for eccentricity is collecting the data.
The hardest part seems to be confirming what the data shows and deciding what to do about it. This may be true for many of the areas, but there is no absolute standard on how much eccentricity indicated on a current spectrum is too much, with the exception of an actual measurement of the physical air gap. Eccentricity analysis is performed utilizing the RIC test and will be most successfully applied in troubleshooting if preexisting RIC data is available. However, even without a baseline test, the RIC test will give definite indications of existing eccentricity.
Analysis of a RIC is done by evaluating the graph of phase-to-phase inductance for the following:
- Scale: sinusoidal Y/N? Characteristics: rotor damage
- Alignment: eccentricity
- Peak-to-peak inductance: eccentricity or stator
Phase-to-phase or turn-to-turn shorts will cause a separation of the three phase sinusoidal RIC graph. The result is either a "two-up/one-down" or a "one-up/two-down" pattern. The pattern depends on whether the stator windings are wye or delta wound.
Air gap eccentricity impacts the alignment of the graph and the peak-to peak inductance values of individual phases. Peak-to-peak variations occur on each phase or between phases, depending on the type of eccentricity. If it is static eccentricity, you may get equal peaks from pole group to pole group on the same phase, but the peak amplitude will be quite different between the pole groups of different phases. Simply put, the graph looks misaligned across the graph. If dynamic eccentricity exists, then peaks from pole group to pole group in the same phase will be different. In a four-pole motor, the rotor is positioned 90° to cover one pole group. When performing a RIC, the PdMA analysis software will use the motor nameplate data to determine the number of poles and then indicate how many degrees the rotor needs to be positioned to cover the first pole group.
Concentric versus lap wound
An important consideration when evaluating RIC data for indication of eccentricity is whether the motor is concentric or lap wound. If a motor is concentric wound, it is built with a preexisting offset between the stator windings and the rotor. The concentric wound motor seen in FIG 33 has the stator windings inserted into the stator slots in a basket form or stacked configuration. Commonly all of the pole groups for phase A are laid into the slots, then all of the pole groups for phase B, then finally all of the pole groups for phase C. This results in a greater distance between the rotor and the phase A coils than exists between rotor and phase C coils. This results in a natural stair stepping indication of the phase-to-phase values seen in FIG 34.
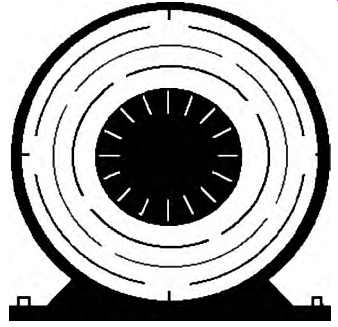
FIG 33 Graph showing concentric wound motor stator windings inserted
into the stator slots in a basket form or stacked configuration.
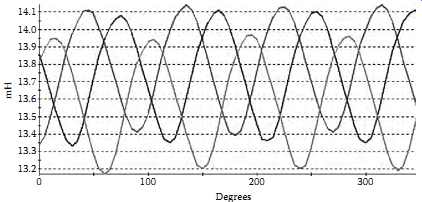
FIG 34 Graph showing phase-to-phase values of pole group windings.
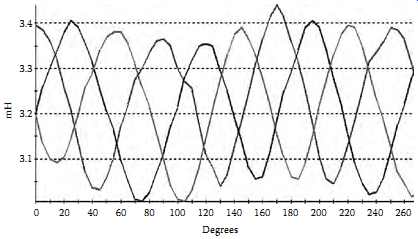
FIG 35 Graph showing an example of a dynamic eccentricity.
Concentric wound motors by design create RIC results that appear as though there may be an eccentricity between the rotor and stator. Results of a RIC performed on a random concentric wound motor can be seen in FIG 35. Notice the peak amplitudes from one pole group to another are basically the same, but different from the other two phases. One phase is always slightly lower and the other phase is always slightly higher.
In a case where concentric wound motors are identified or suspected, the RIC needs to be performed over two pole faces. Place the motor in observe and confirm any suspected eccentricity with correlating evidence, such as EMAX eccentricity analysis or vibration analysis.
Analysis:
FIG 35 shows an example of a dynamic eccentricity. Notice how the peak amplitudes of the blue phase vary from pole group to pole group as the rotor is rotated. This occurs for each of the three phases. Dynamic eccentricity is the more severe type of eccentricity due to the increased chance of a rotor/stator rub.
Eccentricity analysis is performed through a high-frequency spectrum of the current signal. When air gap eccentricity exists in a motor, the air gap flux will be off balance, causing different levels of voltage to be induced onto the rotor. This results in irregular current flow on the rotor and varying levels of counter electromotive force, which is felt by the stator. These varying forces on the stator winding produce changes in the amplitude of the current similar to a load change. By displaying the current in a spectrum format, the modulations can be seen as sideband activity around a location known as the eccentricity frequency (FECC). The FECC is the number of rotor bars multiplied by the shaft frequency (rpm/60) of the motor. The current modulations are seen as peaks on the spectrum, which will be first and third sidebands of the line frequency powering the motor. In a 60 Hz system these peaks will appear as four peaks, 120 Hz apart, and nonsynchronous to line frequency. The peaks are seen in FIG 36.
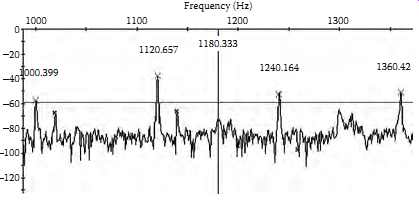
FIG 36 Graph showing current modulations as peaks on the spectrum. (PdMA
Corporation)
In FIG 36, the large X’s indicate the eccentricity-related peaks. The small x’s indicate harmonics of line frequency. The cursor line located at 1180 Hz is the FECC, which is equal to the number of rotor bars times the shaft speed. The speed and rotor bar information is necessary to be able to confirm that the peaks identified on the spectrum are indeed eccentricity related. If the number of rotor bars and the speed are known, the analyzer software automatically places a red X at the four peak locations that identify eccentricity. Obtaining the speed from the Advance Spectral Analysis current demodulation software, low/high resolution rotor test or via a strobe light is the easy part. The rotor bar count; however, is another matter. First, at the earliest opportunity you should verify that a rotor bar count exists on each of your motor repair specifications.
The report you get back from the shop should include how many rotor bars and stator slots exist in the motor. Second, utilize the vibration department to assist in the rotor bar count. They may have previously identified the number of rotor bars through spectrum analysis of the vibration signal.
Eccentricities in the air gap will develop uneven magnetic pull between the stator and rotor during operation. This uneven magnetic pull will lead to increased vibration, mechanical wear and tear, and possibly pullover to the point of a rotor/stator rub. It is important to have equipment, which provides the necessary information to make informed maintenance decisions concerning the severity of an air gap eccentricity.
Impact of variable frequency drives on motor:
The variable frequency drive (VFD) is also called variable speed drive (VSD). The VFD technology has changed how motors are applied today. Many VFDs are being installed today with the motors to gain benefits in energy savings and ability to vary or control the speed of the motor. However, this all comes at a cost, since the VFD is a nonlinear load that generates harmonics and therefore pollutes the power supply to the motor and other loads in the electrical distribution system. This discussion focuses on the effects of VFDs on motors and how motors are impacted by VFDs.
Excessive heat is the first basic issue to be understand. One concern of VFD is their propensity to destroy motors through overheating. Where does the excessive heat come from? Heat results from excessive current flowing through the motor in order for the motor to produce the necessary torque to drive its load. When a motor operates as designed, it will deliver a certain torque for a given current input. If the torque demand changes (as in variations in load), the current demand changes. The motor is designed to account for the current required to provide rated torque and the amount of heat transfer required, to prevent the motor from overheating.
If a motor requires more than full-load current to deliver the rated torque or horse power, then there is either a design flaw with the motor or a problem with the power supply to the motor. Today, motors are designed with longer stretched out frames and much less iron than older designs. A 40 hp motor today is much smaller than the one made years ago. Older motors were able to dissipate heat through the large masses of iron used in their construction.
Today, the heat is removed by transfer to the surface of the motor.
If this higher current is not from the load demand or the design of the motor (and these things should both be considered) then attention should be shifted to power quality. Poor power quality can cause a motor to draw excessive current as a result of harmonics, especially the 2nd, 5th, 11th, and so on. The IEEE standard 519-1992 standard on power quality states that the current distortion at the point of common coupling should not exceed a pre determined value, such as 10% for distribution system rated 15 kV and less.
First, let us understand the power quality problems. Voltage and current harmonic distortion, voltage spikes, voltage unbalance, and PF are a few among the many concerns when discussing power quality. Although all of these are important, we focus on just a few, beginning with harmonic distortion.
From the power quality perspective, the most common reference relating to harmonics is THD. THD is the ratio of the rms of the harmonic content to the rms value of the fundamental quantity, expressed as a percent of the fundamental. Quite simply it is the rms value of the signal with the fundamental frequency removed. A perfect 60 Hz sine wave would have 0% THD. So higher frequency waveforms, that is, voltage and currents that are multiple of the fundamental frequency (60 Hz) would be considered as harmonic distortion.
The following is a graphic representation showing the basic differences between the fundamental 60 Hz signal and the harmonics of the 60 Hz signal.
FIG 37 shows a time domain graph of a three-phase 60 Hz voltage and current signal. Phase 1 has a zero crossing near 0.01 s. The next zero crossing occurs at 180°, just before 0.02 s and completes a cycle at 360°. This is considered the first or fundamental harmonic.
Harmonic distortion is not difficult to understand since this distortion is comprised of higher order signals that are multiples of the 60 Hz fundamental signals. These harmonics can be related to the positive, negative, and zero sequence components that will help in the understanding of why the harmonic distortion causes excessive heating in the motor and other undesirable effects.
In a perfectly balanced three-phase system, only the positive sequence exists. However, when power system becomes unbalanced then all three components exists, i.e., positive, negative, and zero sequence. Similarly, when harmonics are generated by nonlinear load, such as VFD, the electrical distribution system is no longer in balance. As a result, the various order harmonics then can be classified as positive, negative, and zero sequence harmonics because they behave exactly like the original components. Positive sequence harmonics create a magnetic field in the direction of rotation of the fundamental (60 Hz), which is the positive direction of rotation of the motor.
Therefore, the first-order harmonic is a positive sequence harmonic.
The second-order harmonic is 120 Hz and rotating in the opposite direction to the fundamental (60 Hz); therefore, it is called the negative sequence harmonic. Negative sequence harmonics develop magnetic fields in the opposite direction of rotation of the motor thus producing an opposing torque. The opposing torque reduces net positive torque of the motor. Therefore, the motor current increases to make up the torque required for a given load. The rotation of the magnetic field developed by the second harmonic is in reverse order.
The second harmonic sequence is 3, 2, 1. This is in reverse order of the positive sequence and therefore is called negative sequence harmonic.
The third harmonic is called a zero sequence harmonic. This creates a single-phase signal that does not produce a rotating magnetic field. Though this signal performs no real work, it can still increase overall current demand and generate heat. The third harmonic currents flow back to the supply transformer and collect on the neutral leg, creating excessive heat in the transformer. The various order harmonics and their classifications as positive, negative, and zero sequence is shown in TBL. 9.
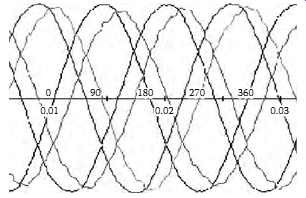
FIG 37 Three-phase 60 Hz fundamental voltage and current waveforms.
====
TBL. 9 Relationship between the Harmonic Order and the Positive, Negative, and Zero Sequence
Harmonic Frequency Sequence Harmonic Frequency Sequence
====
Harmonics are primarily the result of nonlinear (switching) loads such as computers, fluorescent lighting, and VFDs. The presence of harmonics in a distribution system results in excessive heat from increased current required by the loads. For example, a motor designed to pull 100 A at full load may draw 120 A if the harmonic distortion is high. This additional current can lead to insulation damage and possibly a failure of the motor. The voltage distortion is the primary concern for the motor.
====
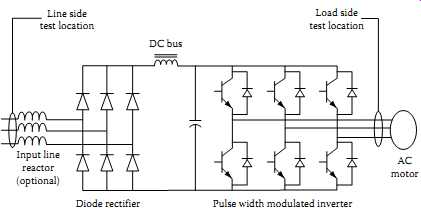
FIG 38 Components of a VFD.
Line side test location DC bus AC motor Load side test location Input line reactor (optional) Diode rectifier Pulse width modulated inverter
====
FIG 38 shows the general makeup of a drive system consisting of three sections (rectifier, storage, and inverter sections). The rectifier section converts the AC signal into a DC signal. The capacitor bank stores this DC power, and the inverter section converts it into a variable AC output. Drives designed to operate DC motors function through similar principles. With DC, the strength of the output signal is regulated instead of the frequency.
The focus of this discussion will be on AC drives.
Common classifications of VFDs available today are variable voltage inverters (VVI), variable current inverters (VCI), and PWM inverters. Each operates differently with its own set of advantages and disadvantages.
Following is brief discussion on these three VFDs.
The above example shows the output of voltage and current from the inverter section of a VVI, sometimes referred to as a voltage source inverter (VSI). This type of drive controls the output voltage, as seen in the six steps that occur throughout a single cycle of the voltage waveform. The current signal is the product of the relationship between the controlled voltage of the drive and the motor impedance ( FIG 39).
A VCI operates on the same principle as the VVI except that it controls the output current. In the case of the VCI, the voltage signal is then the product of the relationship between the controlled current of the drive and the motor impedance.
Although it is easy to see the six pulse influence that both the VVIs and VCIs have on the motor, we also need to be aware of their impact on an unfiltered distribution system upstream of the drive. To minimize the harmonic effects on the distribution system, line reactors or filters may be installed to filter the harmonics.
The third type of drive to be discussed is a newer class of drives, known as the PWM inverters. PWM drives utilize the insulated gate bipolar transistor (IGBT) technology mentioned earlier. Fast rise times, as low as 0.1 µs, can quickly damage older classes of insulation. This is amplified when the surge impedance of the motor is significantly higher than the cable impedance, causing voltage doubling to occur. Incorrect cable lengths are one cause of this impedance mismatch. As a result, the NEMA MG 1-2006, Section IV, Part 31 specification has been rewritten requiring motor insulation subject to VFDs signals, to withstand 1600 V pulses occurring in 0.1 µs or greater ( FIGs 40 and 41).
The major difference between PWM and other classes of drives is that PWM drives do not vary the amplitude of the voltage output. Instead they vary the frequency at which the output voltage is pulsed. By controlling the high frequency on and off times of the voltage output, the appearance of a sinusoidal wave form is accomplished. Although the output voltage is very erratic, the resulting current waveform is extremely smooth.
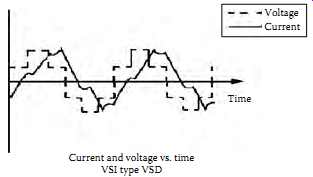
FIG 39 Current and voltage of VVI drive. Current and voltage vs. time
VSI type VSD
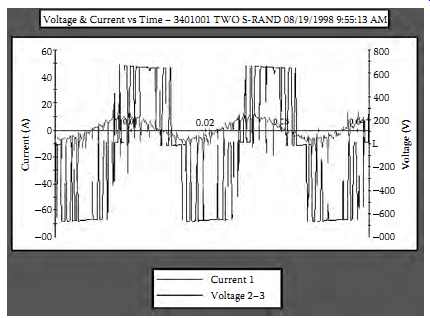
FIG 40 Voltage and current relationship at the output of a PWM drive.
(From Naah Bethel/PdMA, Fault Zone Analysis, Six Part Series on Identifying
Motor Defects. )
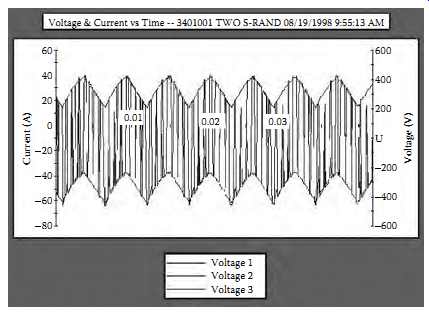
FIG 41 Line-to-neutral voltage output of a PWM drive. (From Naah Bethel/PdMA,
Fault Zone Analysis, Six Part Series on Identifying Motor Defects. )
It is a fact that VFDs can damage the insulation system of a motor. However, with better understanding, it is possible to prevent the premature motor failures. It would be prudent not to install a PWM drive to an aged class B insulation system. Drive manufacturers have increased effectiveness through PWM technology to deliver a clean current waveform. But that current comes with the expense of very fast rise time. Consult the drive manufacturer and develop an understanding of the limitations in place for the installation of VFDs. This includes things such as cable length, modulating frequencies, and impedance matching of the motor and circuit and filtering to ensure a clean distribution system. VFD technology is here to stay and it will continue to improve. Just like motor insulation, it will get better over time. Information and communication is the key to longer motor life.
Application guide for VFDs:
As discussed above, a good understanding of the technology is required when applying VFD to a new and to an existing motor. For VFDs equipped with IGBT technology, the voltage rises from zero to peak in only one-tenth of a microsecond. Unfortunately, there are not many standard design motors, including existing motors that would have sufficient insulation to withstand such a fast voltage rise. High peak voltages can be experienced at the motor terminals especially when the distance between the inverter (drive) and the motor exceeds about 15 m (50 ft). This is typically caused by the voltage doubling phenomenon of a transmission line having unequal line and load impedances. Motor terminal voltage can reach twice the DC bus voltage of the drive in long lead applications. When the characteristic load impedance is greater than the line impedance, then voltage (and current) is reflected from the load back toward the source (drive). The absolute peak voltage is equal to the sum of the incident peak voltage traveling toward the motor plus the reflected peak voltage. If the load characteristic impedance is greater than the characteristic line impedance, then the highest peak voltage will be experienced at the load (motor) terminal. If the DC bus voltage of the drive is 850 V, then motor terminal voltage could reach 1700 V peak.
Fast voltage rise times of 1600 V/µs can be typical as the motor lead length exceeds just a few hundred feet. Voltage rise time is referred to as dv/dt (change in voltage versus change in time). When the rise time is very fast, the motor insulation becomes overstressed. Excessively high dv/dt can cause premature breakdown of standard motor insulation. Inverter duty motors typically have more phase-to-phase and slot insulation than the standard duty motors (NEMA design B).
When motors fail due to insulation stress caused by high peak voltage and fast voltage rise times (high dv/dt) they have common symptoms. Most failures of these types occur in the first turn as either a phase-to-phase short or phase-to-ground short. The highest voltage is seen by the first turns of the winding and due to motor inductance and winding capacitance of the motor, the peak voltage and dv/dt decay rapidly as the voltage travels through the winding. Normally, the turn-to-turn voltage in a motor is quite low because there are many turns in the winding. However when the dv/dt is very high, the voltage gradient between turns and between phase windings can be excessively high, resulting in premature breakdown of the motor insulation system and ultimately motor failure. This problem is most prevalent on 480V system because the peak terminal voltage experienced often exceeds the insulation breakdown voltage rating of the motor.
The standard motor capabilities established by the NEMA and expressed in the MG-I standard (part 30), indicate that standard NEMA type B motors can withstand 1000 V peak at a minimum rise time of 2 µs. Therefore to protect standard NEMA Design B motors, one should limit peak voltage to 1 kV and reduce the voltage rise to less than 500 V/µs.
There are several solutions available to solve this problem, each offering a different degree of protection at a different price. These solutions are:
Inverter duty motors: New motors specifically design for IGBT drive applications should be considered for all new installations. They offer increased winding slot insulation, increased first turn insulation, and increased phase to-phase turn insulation. These motors are more expensive than standard design B motors but are the best motor for the application when it will be controlled by an IGBT variable frequency inverter. The NEMA Standard MG-I (part 31) indicates that inverter duty motors shall be designed to with stand 1600 V peak and rise times of greater than 0.1 µs. Always confirm the actual motor capability with the manufacturer before installation.
Cable length: Minimize the cable between the inverter and motor. Quite often this is not possible, especially when the actual location of motor is at greater distance from the inverter than desired. The longer the cable length, the greater is its capacitance which will result in lower overall cable surge impedance. Therefore, this will result in a greater mismatch between the characteristic impedance of the line (surge impedance) and load impedance, thus giving a higher peak voltage at the motor (load) terminals. By minimizing the cable length, this mismatch problem can be minimized.
Tuned inductor and capacitor (LC) filters: The LC filters are an effective means of cleaning the output voltage waveform and protecting the motor. An LC circuit can result in the best voltage waveform but at a relatively high cost and with some future considerations. The filters are low pass shunt-type filters tuned for a specific frequency, often in the range of 1-2 kHz. Because these filters have essentially zero impedance at the tuned frequency, it is very important that the inverter switching frequency not be set too low. The threat exists that someone may vary the carrier frequency (at a later date) without consideration for the existence of a low pass filter resulting in damage to the drive or filter. One should be very careful when applying these types of filters on the output of a drive with variable carrier frequency. LC filters for these types of applications cost approximately three to four times the cost of a load reactor and do not offer the most optimal solution.
RC snubber networks: The RC networks can reduce the slope of the voltage waveform leading edge and reduce the peak voltage of the waveform but they have a minimal effect on the actual waveshape. They perform margin ally when compared to the other solutions. The RC networks are less costly than LC filters and they provide marginal benefits. The cost of RC network can be -two to three times the cost of a load reactor.
Load reactors: The load reactors offer the most cost-effective means of solving high dv/dt and peak voltage problems associated with IGBT drives. Typical experience shows that peak voltage is limited to 1000 V or less (actual value varies based upon system voltage). Voltage rise time (dv/dt) is typically extended to several microseconds resulting in only about 75-200 V/µs rise times. Usually the load reactor is all that is needed to adequately protect the motor from dv/dt and to allow full warranty of the motor applied in IGBT drive applications. The load reactor may be installed at the drive or at the motor location. It offers the best dv/dt reduction when placed at the drive. Placing the reactor at the drive also provides voltage stress protection for the motor cables. Several manufacturers offer line/load reactors that are specially constructed for IGBT drive applications. These reactors have a 4000 V rms (5600 V peak) insulation dielectric strength and are approved by both CSA and UL (UL506 & UL508).