AMAZON multi-meters discounts AMAZON oscilloscope discounts
1 Basic Load Characterization
2 Composite Loads and Composite Load Characterization: Coincidence and Diversity • Load Curves and Load Duration
3 Composite Load Modeling
4 Other Load-Related Issues: Cold Load Pickup • Harmonics and Other Nonsinusoidal Loads
Utilization is the "end result" of the generation, transmission, and distribution of electric power. The energy carried by the transmission and distribution system is turned into useful work, light, heat, or a combination of these items at the utilization point. Understanding and characterizing the utilization of electric power is critical for proper planning and operation of power systems. Improper characterization of utilization can result of over or under building of power system facilities and stressing of system equipment beyond design capabilities. This section describes some of the basic concepts used to characterize and model loads in electric power systems.
The term load refers to a device or collection of devices that draw energy from the power system.
Individual loads (devices) range from small light bulbs to large induction motors to arc furnaces. The term load is often somewhat arbitrarily applied, at times being used to describe a specific device, and other times referring to an entire facility and even being used to describe the lumped power requirements of power system components and connected utilization devices downstream of a specific point in large-scale system studies.
1 Basic Load Characterization
A number of terms are used to characterize the magnitude and intensity of loads. Several such terms are defined and uses outlined below.
Energy-Energy use (over a specified period of time) is a key identifying parameter for power system loads. Energy use is often recorded for various portions of the power system (e.g., homes, businesses, feeders, substations, districts). Utilities report aggregate system energy use over a variety of time frames (daily, weekly, monthly, and annually). System energy use is tied directly to sales and thus is often used as a measure of the utility or system performance from one period to another.
Demand-Loads require specific amounts of energy over short periods of time. Demand is a measure of this energy and is expressed in terms of power (kilowatts or Megawatts). Instantaneous demand is the peak instantaneous power use of a device, facility, or system. Demand, as commonly referred to in utility discussions, is an integrated demand value, most often integrated over 10, 15, or 30 min. Integrated demand values are determined by dividing the energy used by the time interval of measurement or the demand interval.
Demand Energy Use Over Demand Interval Demand Interval
Integrated demand values can be much lower than peak instantaneous demand values for a load or facility.
Demand factor-Demand factor is a ratio of the maximum demand to the total connected load of a sys tem or the part of the system under consideration. Demand factor is often used to express the expected diversity of individual loads within a facility prior to construction. Use of demand factors allows facility power system equipment to be sized appropriately for the expected loads (National Electric Code, 1996).
Demand Factor Maximum Demand Total Connected Load
Load factor-Load factor is similar to demand factor and is calculated from the energy use, the demand, and the period of time associated with the measurement.
Load Factor Energy Use Demand Time
A high load factor is typically desirable, indicating that a load or group of loads operates near its peak most of the time, allowing the greatest benefit to be derived from any facilities installed to serve the load.
2 Composite Loads and Composite Load Characterization
It’s impractical to model each individual load connected to a power system to the level of detail at which power is delivered to each individual utilization device. Loads are normally lumped together to represent all of the "downstream" power system components and individual connected loads. This grouping occurs as a result of metering all downstream power use from a certain point in the power system, or as a result of model simplification in which effects of the downstream power system and connected loads are represented by a single load in system analysis.
2.1 Coincidence and Diversity
Although individual loads vary unpredictably from hour to hour and minute to minute, an averaging effect occurs as many loads are examined in aggregate. This effect begins at individual facilities (home, commercial establishment, or industrial establishment) where all devices are seldom if ever in operation at the same instant. Progressing from an individual facility to the distribution and transmission systems, the effect is compounded, resulting in somewhat predictable load characteristics.
Diversity is a measure of the dispersion of the individual loads of a system under observation over time. Diversity is generally low in individual commercial and industrial installations. However, at a feeder level, diversity is a significant factor, allowing more economical choices for equipment since the feeder needs to supply power to the aggregate peak load of the connected customers, not the sum of the customer individual (non-coincident) peak loads.
Groups of customers of the same class (i.e., residential, commercial, industrial) tend to have an aggregate peak load per customer that decreases as the number of customers increases. This tendency is termed coincidence and has significant impact on the planning and construction of power systems. For example, load diversity would allow a feeder or substation to serve a number of customers whose individual (non-coincident) peak demands may exceed the feeder or substation rating by a factor of two or more.
Coincidence Factor Aggregate Demand for a Group of Customers Sum of Individual Customer Demands
Note that there is a minor but significant difference between coincidence (and its representation as a coincidence factor) and the demand factor discussed above. The coincidence factor is based on the observed peak demand for individuals and groups, whereas the demand factor is based on the connected load.
2.2 Load Curves and Load Duration
Load curves and load duration curves graphically convey very detailed information about the characteristics of loads over time. Load curves typically display the load of a customer class, feeder, or other portion of a power system over a 24 h period. Load duration curves display the cumulative amount of time that load levels are experienced over a period of time.
Load curves represent the demand of a load or groups of load over a period of time, typically 24 h. The curves provide "typical" load levels for a customer class on an hour-by-hour or minute-by-minute basis.
The curves themselves represent the demand of a certain class of customers or portion of the system.
The area under the curve represents the corresponding energy use over the time period under consideration. Load curves provide easily interpreted information regarding the peak load duration as well as the variation between minimum and maximum load levels. Load curves provide key information for daily load forecasts allowing planners and operators to ensure system capacity is available to meet customer needs. Three sample load curves (for residential, commercial, and industrial customer classes) are shown in Figs 1 - 3.
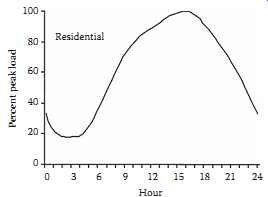
FIG. 1 Residential load curve.
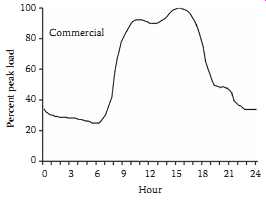
FIG. 2 Commercial load curve.
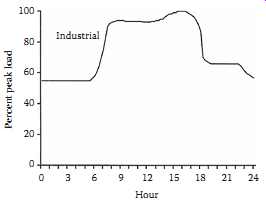
FIG. 3 Industrial load curve.
Load curves can also be developed on a feeder or substation basis, as a composite representation of the load profile of a portion of the system.
Load duration curves quickly convey the duration of the peak period for a portion of a power system over a given period of time. Load duration curves plot the cumulative amount of time that load levels are seen over a specified time period. The information conveyed graphically in a load duration curve, although more detailed, is analogous to the information provided by the load factor discussed above.
A sample load duration curve is shown in FIG. 4.
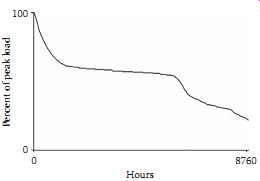
FIG. 4 Annual load duration curve.
Load duration curves are often characterized by very sharp ascents to the peak load value. The shape of the remainder of the curves vary based on utilization patterns, size, and content of the system for which the load duration curve is plotted.
3 Composite Load Modeling
Load models can generally be divided into a variety of categories for modeling purposes. The appropriate load model depends largely on the application. For example, for switching transient analyses, simple load models as combinations of time-invariant circuit elements (resistors, inductors, capacitors) and/or voltage sources are usually sufficient. Power flow analyses are performed for a specific operating point at a specific frequency, allowing loads to be modeled primarily as constant impedance or constant power. However, midterm and extended term transient stability analyses require that load voltage and frequency dependencies be modeled, requiring more complex aggregate load models. Two load models are discussed below.
Composite loads exhibit dependencies on frequency and voltage. Both linear and exponential models are used for addressing these dependencies.
Linear voltage and frequency dependence model-The linear model provides excellent representation of load variations as frequency and voltages vary by small amounts about a nominal point.
The values for the partial derivatives with respect to voltage and frequency can be determined through analysis of metered load data recorded during system disturbances or in the case of very simple loads, through calculations based on the equivalent circuit models of individual components.
Exponential voltage and frequency dependence model-The exponential model provides load characteristics useful in midterm and extended term stability simulations in which the changes in system frequency and voltage are explicitly modeled in each time step.
4 Other Load-Related Issues
4.1 Cold Load Pickup
Following periods of extended service interruption, the advantages provided by load diversity are often lost. The term cold load pickup refers to the energization of the loads associated with a circuit or substation following an extended interruption during which much of the diversity normally encountered in power systems is lost.
For example, if a feeder suffers an outage, interrupting all customers on the feeder during a particularly cold day, the homes and businesses will cool to levels below the individual thermostat settings.
This situation eliminates the diversity normally experienced, where only a fraction of the heating will be required to operate at any given time. Once power is restored, the heating at all customer locations served by the feeder will attempt to operate to bring the building temperatures back to levels near the thermostat settings. The load experienced by the feeder following re-energization can be far in excess of the design loading due to lack of load diversity.
Cold load pickup can result in a number of adverse power system reactions. Individual service transformers can become overloaded under cold load pickup conditions, resulting in loss of life and possible failure due to overheating. Feeder load levels can exceed protective device ratings/settings, resulting in customer interruptions following initial service restoration. Additionally, the heavily loaded system conditions can result in conductors sagging below their designed minimum clearance levels, creating safety concerns.
4.2 Harmonics and Other Nonsinusoidal Loads
Electronic loads that draw current from the power system in a nonsinusoidal manner represent a significant portion of the load connected to modern power systems. These loads cause distortions of the generally sinusoidal characteristics traditionally observed. Harmonic loads include power electronic based devices (rectifiers, motor drives, switched mode power supplies, etc.) and arc furnaces. More details on power electronics and their effects on power system operation can be found in the power electronics section of this handbook.