AMAZON multi-meters discounts AMAZON oscilloscope discounts
.
1 The Electromechanical Meter: Single Stator Electromechanical Meter
2 Blondel's Theorem
3 The Electronic Meter: Multifunction Meter • Voltage Ranging and Multiform Meter • Site Diagnostic Meter
4 Special Metering: Demand Metering • Time of Use Metering • Interval Data Metering • Pulse Metering • Totalized Metering
5 Instrument Transformers: Measuring kVA
6 Defining Terms
Electrical metering deals with two basic quantities: energy and power. Energy is equivalent to work. Power is the rate of doing work. Power applied (or consumed) for any length of time is energy. In mathematical terms, power integrated over time is energy. The basic electrical unit of energy is the watthour.
The basic unit of power is the watt. The watthour meter measures energy (in watthours), while the watt meter measures the rate of energy, power (in watthours per hour or simply watts). For a constant power level, power multiplied by time is energy. For example, a watthour meter connected for 2h in a circuit using 500 W (500 Wh/h) will register 1000 Wh.
1 The Electromechanical Meter
The electromechanical watt-hour meter is basically a very specialized electric motor, consisting of
- • A stator and a rotor that together produce torque
- • A brake that creates a counter torque
- • A register to count and display the revolutions of the rotor
1.1 Single Stator Electromechanical Meter
A two-wire single stator meter is the simplest electromechanical meter. The single stator consists of two electromagnets. One electromagnet is the potential coil connected between the two circuit conductors.
The other electromagnet is the current coil connected in series with the load current. FIG. 1 shows the major components of a single stator meter.
===
Line Stator; Line Load; Load; Potential coil; Permanent magnet (braking); Rotor (disk); Current coil
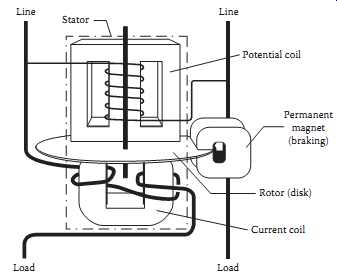
FIG. 1 Main components of electromechanical meter.
===
The electromagnetic fields of the current coil and the potential coil interact to generate torque on the rotor of the meter. This torque is proportional to the product of the source voltage, the line current, and the cosine of the phase angle between the two. Thus, the torque is also proportional to the power in the metered circuit.
The device described so far is incomplete. In measuring a steady power in a circuit, this meter would generate constant torque causing steady acceleration of the rotor. The rotor would spin faster and faster until the torque could no longer overcome friction and other forces acting on the rotor. This ultimate speed would not represent the level of power present in the metered circuit.
To address these problems, designers add a permanent magnet whose magnetic field acts on the rotor. This field interacts with the rotor to cause a counter torque proportional to the speed of the rotor. Careful design and adjustment of the magnet strength yields a meter that rotates at a speed proportional to power. This speed can be kept relatively slow. The product of the rotor speed and time is revolutions of the rotor. The revolutions are proportional to energy consumed in the metered circuit. One revolution of the rotor represents a fixed number of watthours. The revolutions are easily converted via mechanical gearing or other methods into a display of watthours or, more commonly, kilowatt-hours.
2 Blondel's Theorem
Blondel's theorem of polyphase metering describes the measurement of power in a polyphase system made up of an arbitrary number of conductors. The theorem provides the basis for correctly metering power in polyphase circuits. In simple terms, Blondel's theorem states that the total power in a system of (N) conductors can be properly measured by using (N) wattmeters or watt-measuring elements. The elements are placed such that one current coil is in each of the conductors and one potential coil is connected between each of the conductors and some common point. If this common point is chosen to be one of the (N) conductors, there will be zero voltage across one of the measuring element potential coils.
This element will register zero power. Therefore, the total power is correctly measured by the remaining (N - 1) elements.
In application, this means that to accurately measure the power in a four-wire three-phase circuit (N = 4), the meter must contain (N - 1) or three measuring elements. Likewise, for a three-wire three phase circuit (N = 3), the meter must contain two measuring elements. There are meter designs available that, for commercial reasons, employ less than the minimum number of elements (N - 1) for a given circuit configuration. These designs depend on balanced phase voltages for proper operation. Their accuracy suffers as voltages become unbalanced.
3 The Electronic Meter
Since the 1980s, meters available for common use have evolved from (1) electromechanical mechanisms driving mechanical, geared registers to (2) the same electromechanical devices driving electronic registers to (3) totally electronic (or solid state) designs. All three types remain in wide use, but the type that is growing in use is the solid state meter.
The addition of the electronic register to an electromechanical meter provides a digital display of energy and demand. It supports enhanced capabilities and eliminates some of the mechanical complexity inherent in the geared mechanical registers.
Electronic meters contain no moving mechanical parts-rotors, shafts, gears, bearings. They are built instead around large-scale integrated circuits, other solid state components, and digital logic. Such meters are much more closely related to computers than to electromechanical meters.
The operation of an electronic meter is very different than that described in earlier sections for an electromechanical meter. Electronic circuitry samples the voltage and current waveforms during each electrical cycle and converts these samples to digital quantities. Other circuitry then manipulates these values to determine numerous electrical parameters, such as kW, kWh, kvar, kvarh, kQ, kQh, power factor, kVA, rms current, rms voltage.
Various electronic meter designs also offer some or all of the following capabilities:
• Time of use (TOU). The meter keeps up with energy and demand in multiple daily periods.
• Bi-directional. The meter measures (as separate quantities) energy delivered to and received from a customer. This feature is used for a customer that is capable of generating electricity and feeding it back into the utility system.
• Loss compensation. The meter can be programmed to automatically calculate watt and var losses in transformers and electrical conductors based on defined or tested loss characteristics of the trans formers and conductors. It can internally add or subtract these calculated values from its measured energy and demand. This feature permits metering to be installed at the most economical location.
For instance, we can install metering on the secondary (e.g., 4 kV) side of a customer substation, even when the contractual service point is on the primary (e.g., 110 kV) side. The 4 kV metering installation is much less expensive than a corresponding one at 110 kV. Under this situation, the meter compensates its secondary-side energy and demand readings to simulate primary-side readings.
• Interval data recording. The meter contains solid state memory in which it can record up to several months of interval-by-interval data.
• Remote communications. Built-in communications capabilities permit the meter to be interrogated remotely via telephone, radio, or other communications media.
• Diagnostics. The meter checks for the proper voltages, currents, and phase angles on the meter conductors.
• Power quality. The meter can measure and report on momentary voltage or current variations and on harmonic conditions.
Note that many of these features are available only in the more advanced (and expensive) models of electronic meters.
As an example of the benefits offered by electronic meters, consider the following two methods of metering a large customer who is capable of generating and feeding electricity back to the utility. In this example, the metering package must perform these functions:
Measure kWh delivered to the customer Measure kWh received from the customer Measure kvarh delivered Measure kvarh received Measure kW delivered Measure kW received Compensate received quantities for transformer losses Record the measured quantities for each demand interval Method A. (2) kW/kWh electromechanical meters with pulse generators (one for delivered, one for received) (2) kWh electromechanical meters with pulse generators (to measure kvarh) (2) Phase shifting transformers (used along with the kWh meters to measure kvarh) (2) Transformer loss compensators (1) Pulse data recorder
Method B. (1) Electronic meter
Obviously, the electronic installation is much simpler. In addition, it’s less expensive to purchase and install and is easier to maintain.
Benefits common to most solid state designs are high accuracy and stability. Another less obvious advantage is in the area of error detection. When an electromechanical meter develops a serious problem, it may produce readings in error by any arbitrary amount. An error of 10%, 20%, or even 30% can go undetected for years, resulting in very large over- or under-billings. However, when an electronic meter develops a problem, it’s more likely to produce an obviously bad reading (e.g., all zeroes; all 9s; a demand 100 times larger than normal; or a blank display). This greatly increases the likelihood that the error will be noticed and reported soon after it occurs. The sooner such a problem is recognized and corrected, the less inconvenience and disruption it causes to the utility and to the customer.
3.1 Multifunction Meter
Multifunction or extended function refers to a meter that can measure reactive or apparent power (e.g., kvar or kVA) in addition to real power (kW). By virtue of their designs, many electronic meters inherently measure the quantities and relationships that define reactive and apparent power. It’s a relatively simple step for designers to add meter intelligence to calculate and display these values.
3.2 Voltage Ranging and Multiform Meter
Electronic meter designs have introduced many new features to the watthour metering world. Two features, typically found together, offer additional flexibility, simplified application, and opportunities for reduced meter inventories for utilities.
• Voltage ranging-Many electronic meters incorporate circuitry that can sense the voltage level of the meter input signals and adjust automatically to meter correctly over a wide range of voltages.
For example, a meter with this capability can be installed on either a 120 or 277 V service.
• Multiform-Meter form refers to the specific combination of voltage and current signals, how they are applied to the terminals of the meter, and how the meter uses these signals to measure power and energy. For example, a Form 15 m would be used for self-contained application on a 120/240 V four-wire delta service, while a Form 16 m would be used on a self-contained 120/208 V four-wire wye service. A multiform 15/16 m can work interchangeably on either of these services.
3.3 Site Diagnostic Meter
Newer meter designs incorporate the ability to measure, display, and evaluate the voltage and current magnitudes and phase relationships of the circuits to which they are attached. This capability offers important advantages:
• At the time of installation or reinstallation, the meter analyzes the voltage and current signals and determines if they represent a recognizable service type.
• Also at installation or reinstallation, the meter performs an initial check for wiring errors such as crossed connections or reversed polarities. If it finds an error, it displays an error message so that corrections can be made.
• Throughout its life, the meter continuously evaluates voltage and current conditions. It can detect a problem that develops weeks, months, or years after installation, such as tampering or deteriorated CT or VT wiring.
• Field personnel can switch the meter display into diagnostic mode. It will display voltage and cur rent magnitudes and phase angles for each phase. This provides a quick and very accurate way to obtain information on service characteristics.
If a diagnostic meter detects any error that might affect the accuracy of its measurements, it will lock its display in error mode. The meter continues to make energy and demand measurements in the back ground. However, these readings cannot be retrieved from the meter until the error is cleared. This ensures the error will be reported the next time someone tries to read the meter.
===
Power (W/kW) One demand interval
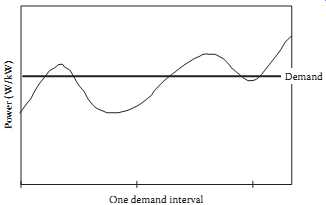
FIG. 2 Instantaneous power vs. demand.
===
4 Special Metering
4.1 Demand Metering
4.1.1 What is Demand?
Electrical energy is commonly measured in units of kilowatt-hours. Electrical power is expressed as kilowatt-hours per hour or, more commonly, kilowatts.
Demand is defined as power averaged over some specified period. FIG. 2 shows a sample power curve representing instantaneous power. In the time interval shown, the integrated area under the power curve represents the energy consumed during the interval. This energy, divided by the length of the interval (in hours) yields "demand." In other words, the demand for the interval is that value of power that, if held constant over the interval, would result in an energy consumption equal to that energy the customer actually used.
Demand is most frequently expressed in terms of real power (kilowatts). However, demand may also apply to reactive power (kilovars), apparent power (kilovolt-amperes), or other suitable units. Billing for demand is commonly based on a customer's maximum demand reached during the billing period.
4.1.2 Why is Demand Metered?
Electrical conductors and transformers needed to serve a customer are selected based on the expected maximum demand for the customer. The equipment must be capable of handling the maximum levels of voltages and currents needed by the customer. A customer with a higher maximum demand requires a greater investment by the utility in equipment. Billing based on energy usage alone does not necessarily relate directly to the cost of equipment needed to serve a customer. Thus, energy billing alone may not equitably distribute to each customer an appropriate share of the utility's costs of doing business.
For example, consider two commercial customers with very simple electricity needs. Customer A has a demand of 25 kW and operates at this level 24 h per day. Customer B has a maximum demand of 100 kW but operates at this level only 4 h per day. For the remaining 20 h of the day, "B" operates at a 10 kW power level.
A uses 25kW 24h 600kWh per day B uses (100kW 4h) (10kW 20h) 600kWh per day
Assuming identical billing rates, each customer would incur the same energy costs. However, the utility's equipment investment will be larger for Customer B than for Customer A. By implementing a charge for demand as well as energy, the utility would bill Customer A for a maximum demand of 25 kW and Customer B for 100 kW. "B" would incur a larger total monthly bill, and each customer's bill would more closely represent the utility's cost to serve.
4.1.3 Integrating Demand Meters
By far the most common type of demand meter is the integrating demand meter. It performs two basic functions. First, it measures the average power during each demand interval. (Common demand interval lengths are 15, 30, or 60 min.) See Table 1. The meter makes these measurements interval-by interval throughout each day. Second, it retains the maximum of these interval measurements.
The demand calculation function of an electronic meter is very simple. The meter measures the energy consumed during a demand interval, then multiplies by the number of demand intervals per hour. In effect, it calculates the energy that would be used if the rate of usage continued for 1 h. The following table illustrates the correspondence between energy and demand for common demand interval lengths.
After each measurement, the meter compares the new demand value to the stored maximum demand.
If the new value is greater than that stored, the meter replaces the stored value with the new one.
Otherwise, it keeps the previously stored value and discards the new value. The meter repeats this process for each interval. At the end of the billing period, the utility records the maximum demand, then resets the stored maximum demand to zero. The meter then starts over for the new billing period.
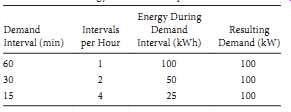
TABLE 1 Energy/Demand Comparisons Demand Interval (min) Intervals per Hour
Energy During Demand Interval (kWh) Resulting Demand (kW)
4.2 Time of Use Metering
A time of use meter measures and stores energy (and perhaps demand) for multiple periods in a day. For example, a service rate might define one price for energy used between the hours of 12 noon and 6 p.m. and another rate for that used outside this period. The TOU meter will identify the hours from 12 noon until 6 p.m. as "Rate 1." All other hours would be "Rate 2." The meter will maintain separate measurements of Rate 1 energy (and demand) and Rate 2 energy (and demand) for the entire billing period.
Actual TOU service rates can be much more complex than this example, including features such as:
• More than two periods per day,
• Different periods for weekends and holidays, and
• Different periods for different seasons of the year.
A TOU meter depends on an internal clock/calendar for proper operation. It includes battery backup to maintain its clock time during power outages.
4.3 Interval Data Metering
The standard method of gathering billing data from a meter is quite simple. The utility reads the meter at the beginning of the billing period and again at the end of the billing period. From these readings, it determines the energy and maximum demand for that period. This information is adequate to deter mine the bills for the great majority of customers. However, with the development of more complex service rates and the need to study customer usage patterns, the utility sometimes wants more detail about how a customer uses electricity. One option would be to read the meter daily. That would allow the utility to develop a day-by-day pattern of the customer's usage. However, having someone visit the meter site every day would quickly become very expensive. What if the meter could record usage data every day? The utility would have more detailed usage data, but would only have to visit the meter when it needed the data, for instance, once per month. And if the meter is smart enough to do that, why not have it record data even more often, for instance every hour? In very simple terms, this is what interval data metering does. The interval meter includes sufficient circuitry and intelligence to record usage multiple times per hour. The length of the recording interval is programmable, often over a range from 1 to 60 min. The meter includes sufficient solid state memory to accumulate these interval readings for a minimum of 30 days at 15-min intervals. Obviously, more frequent recording times reduce the days of storage available.
A simple kWh/kW recording meter typically records one set of data representing kWh. This provides the detailed usage patterns that allow the utility to analyze and evaluate customer "load profiles" based on daily, weekly, monthly, or annual bases. An extended function meter is commonly programmed to record two channels of data, e.g., kWh and kvarh. This provides the additional capability of analyzing customers' power factor patterns over the same periods. Though the meter records information in energy units (kWh or kvarh), it’s a simple matter to convert this data to equivalent demand (kW or kvar). Since demand represents energy per unit time, simply divide the energy value for one recorder interval by the length of the interval (in hours). If the meter records 16.4 kWh in a 30-min period, the equivalent demand for that period is 16.4 kWh/(0.5 h) = 32.8 kW.
A sample 15-min interval load shape for a 24-h period is shown in the graph in FIG. 3. The mini mum demand for that period was 10.5 kW, occurring during the interval ending at 04:30. The maximum demand was 28.7 kW, occurring during the interval ending at 15:15, or 3:15 p.m.
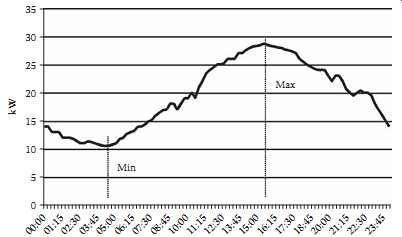
FIG. 3 Graph of interval data.
4.4 Pulse Metering
Metering pulses are signals generated in a meter for use outside the meter. Each pulse represents a discrete quantity of the metered value, such as kWh, kVAh, or kvarh. The device receiving the pulses determines the energy or demand at the meter by counting the number of pulses occurring in some time interval.
A pulse is indicated by the transition (e.g., open to closed) of the circuit at the meter end. Pulses are commonly transmitted on small conductor wire circuits. Common uses of pulses include providing signals to:
• Customer's demand indicator
• Customer's energy management system
• A totalizer (see Section 4.5)
• A metering data recorder
• A telemetering device that converts the pulses to other signal forms (e.g., telephone line tones or optical signals) for transmission over long distances
Pulse metering is installed when customer service requirements, equipment configurations, or other special requirements exceed the capability of conventional metering. Pulse metering is also used to transmit metered data to a remote location.
4.4.1 Recording Pulses
A meter pulse represents a quantity of energy, not power. For example, a pulse is properly expressed in terms of watthours (or kWh) rather than watts (or kW). A pulse recorder will associate time with pulses as it records them. If set up for a 15-min recording interval, the recorder counts pulses for 15 min, then records that number of pulses. It then counts pulses for the next 15 min, records that number, and so on, interval after interval, day after day. It’s a simple matter to determine the number of pulses recorded in a chosen length of time. Since the number of pulses recorded represents a certain amount of energy, simply divide this energy by the corresponding length of time (in hours) to determine average power for that period.
Example: For a metering installation, we are given that each pulse represents 2400 Wh or 2.4 kWh. In a 15-min period, we record 210 pulses. What is the corresponding energy (kWh) and demand (kW) during this 15-min interval?
Total energy in interval 2.4kWh per pulse 210 pulses 504kWh Demand
= × =
dd Energy/Time 504kWh/0.25h 2016kW = = =
Often, a customer asks for the demand value of a pulse, rather than the energy value. The demand value is dependent on demand interval length. The demand pulse value is equal to the energy pulse value divided by the interval length in hours.
For the previous example, the kW pulse value would be:
2.4kWh per pulse/0.25h 9.6kW per pulse =
…and the resulting demand calculation is:
Demand 9.6kW per pulse 210 pulses 2016 kW = × =
Remember, however, that a pulse demand value is meaningful only for a specific demand interval. In the example above, counting pulses for any period other than 15 min and then applying the kW pulse value will yield incorrect results for demand.
4.4.2 Pulse Circuits
Pulse circuits commonly take two forms:
• Form A, a two-wire circuit where a switch toggles between closed and open. Each transition of the circuit (to open or to closed) represents one pulse.
• Form C, a three-wire circuit where the switch flip-flops. Each transition (from closed on one side to closed on the other) represents one pulse.
Use care in interpreting pulse values for these circuits. The value will normally be expressed per transition. With Form C circuits, a transition is a change from closed on the first side to closed on the second side. Most receiving equipment interprets this properly. However, with Form A circuits, the transition is defined as a change from open to closed or from closed to open. An initially open Form A circuit that closes, then opens has undergone two (2) transitions. If the receiving equipment counts only circuit closures, it will record only half of the actual transitions. This is not a problem if the applicable pulse value of the Form A circuit is doubled from the rated pulse weight per transition. For example, if the value of a Form A meter pulse is 3.2 kWh per transition, the value needed for a piece of equipment that only counted circuit closures would be 3.2 × 2 = 6.4 kWh per pulse.
4.5 Totalized Metering
Totalized metering refers to the practice of combining data to make multiple service points look as if they were measured by a single meter. This is done by combining two or more sets of data from separate meters to generate data equivalent to what would be produced by a single "virtual meter" that measured the total load. This combination can be accomplished by:
• Adding recorded interval data from multiple meters, usually on a computer
• Adding (usually on-site) meter pulses from multiple meters by a special piece of metering equipment known as a totalizer
• Paralleling the secondaries of current transformers (CTs) located in multiple circuits and feeding the combined current into a conventional meter (this works only when the service voltages and ratios of the CTs are identical)
• Using a multi-circuit meter, which accepts the voltage and current inputs from multiple services
Form A Form C
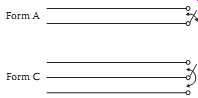
FIG. 4 Pulse circuits.
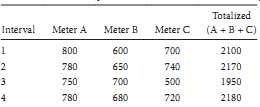
TABLE 2 Example of Totalized Meter Data
Totalized demand is the sum of the coincident demands and is usually less than the sum of the individual peak demands registered by the individual meters. Totalized energy equals the sum of the energies measured by the individual meters.
Table 2 illustrates the effects of totalizing a customer served by three delivery (and metering) points.
It presents the customer's demands over a period of four demand intervals and illustrates the difference in the maximum totalized demand compared to the sum of the individual meter maximum demands.
The peak kW demand for each meter point is shown in bold. The sum of these demands is 2240 kW. However, when summed interval-by-interval, the peak of the sums is 2180 kW. This is the totalized demand. The difference in the two demands, 60 kW, represents a cost savings to the customer. It should be clear why many customers with multiple service points desire to have their demands totalized.
5 Instrument Transformers
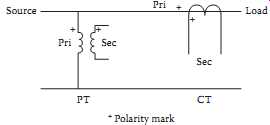
FIG. 5 Instrument transformer symbols.
Instrument transformers is the general name for members of the family of CTs and voltage transformers (VTs) used in metering. They are high-accuracy transformers that convert load currents or voltages to other (usually smaller) values by some fixed ratio. Voltage transformers are also often called potential transformers (PTs). The terms are used interchangeably in this section. CTs and VTs are most commonly used in services where the current and/or voltage levels are too large to be applied directly to the meter.
A current transformer is rated in terms of its nameplate primary current as a ratio to 5 amps secondary cur rent (e.g., 400:5). The CT is not necessarily limited to this nameplate current. Its maximum capacity is found by multiplying its nameplate rating by its rating factor. This yields the total current the CT can carry while maintaining its rated accuracy and avoiding thermal overload. For example, a 200:5 CT with a rating factor of 3.0 can be used and will maintain its rated accuracy up to 600 amps. Rating factors for most CTs are based on open-air outdoor conditions. When a CT is installed indoors or inside a cabinet, its rating factor is reduced.
A VTs is rated in terms of its nameplate primary voltage as a ratio to either 115 or 120 V secondary voltage (e.g., 7,200:120 or 115,000:115). These ratios are sometimes listed as an equivalent ratio to 1 (e.g., 60:1 or 1000:1).
Symbols for a CT and a PT connected in a two-wire circuit are shown in FIG. 5.
5.1 Measuring kVA
In many cases, a combination watthour demand meter will provide the billing determinants for small- to medium-sized customers served under rates that require only real power (kW) and energy (kWh).
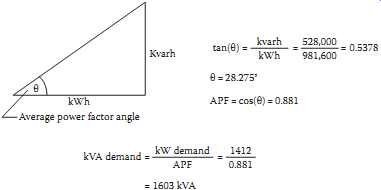
FIG. 6 Calculation of kVA demand using the average power factor method.
Rates for larger customers often require an extended function meter to provide the additional reactive or apparent power capability needed to measure or determine kVA demand. There are two common methods for determining kVA demand for billing.
1. Actual kVA. This method directly measures actual kVA, a simple matter for electronic meters.
2. Average Power Factor (APF) kVA.
This method approaches the measurement of kVA in a more round-about fashion. It was developed when most metering was done with mechanical meters that could directly measure only real energy and power (kWh and kW). With a little help, they could measure kvarh. Those few meters that could measure actual kVA were very complex and demanded frequent maintenance. The APF method of calculating kVA addressed these limitations. It requires three (3) pieces of meter information:
• Total real energy (kWh)
• Maximum real demand (kW)
• Total reactive energy (kvarh)
These can be measured with two standard mechanical meters. The first meter measures kWh and kW. With the help of a special transformer to shift the voltage signals 90° in phase, the second mechanical meter can be made to measure kvarh.
Average power factor kVA is determined by calculating the customer's "APF" over the billing period using the total kWh and kvarh for the period. This APF is then applied to the maximum kW reading to yield APF kVA. An example of this calculation process follows.
Customer: XYZ Corporation Billing determinants obtained from the meter:
kWh 981,600 kvarh 528,000 kW 1,412
The calculations are shown in FIG. 6.
6 Defining Terms
Class-The class designation of a watthour meter represents the maximum current at which the meter can be operated continuously with acceptable accuracy and without excessive temperature rise.
Examples of common watthour meter classes are:
Self-contained-Class 200, 320, or 400 Transformer rated-Class 10 or 20
Test amperes (TA)-The test amperes rating of a watthour meter is the current that is used as a base for adjusting and determining percent registration (accuracy). Typical test current ratings and their relations to meter class are:
Class 10 and 20-TA 2.5 Class 200-TA 30 Self-contained meter-A self-contained meter is one designed and installed so that power flows from the utility system through the meter to the customer's load. The meter sees the total load current and full service voltage.
Transformer rated meter-A transformer rated meter is one designed to accept reduced levels of current and/or voltage that are directly proportional to the service current and voltage. The primary windings of CTs and/or VTs are placed in the customer's service and see the total load current and full service volt age. The transformer rated meter connects into the secondary windings of these transformers.
Meter element-A meter element is the basic energy and power measurement circuit for one set of meter input signals. It consists of a current measurement device and a voltage measurement device for one phase of the meter inputs. Usually, a meter will have one less element than the number of wires in the circuit being metered. That is, a four-wire wye or delta circuit will be metered by a three-element meter; a three-wire delta circuit will be metered by a two-element meter, although there are numerous exceptions.
CT PT ratio-A number or factor obtained by multiplying the current transformer ratio by the PT ratio.
Example: If a meter is connected to 7200:120 V PTs (60:1) and 600:5 CTs (120:1), the CT PT ratio is 60 × 120 = 7200. A metering installation may have CTs but no PT in which case the CT PT ratio is just the CT ratio.
Meter multiplier-Also called the dial constant or kilowatt-hour constant, this is the multiplier used to convert meter kWh readings to actual kWh. The meter multiplier is the CT PT ratio. For a self-contained meter, this constant is 1.
Further Information
Further information and more detail on many of the topics related to metering can be found in the Hand book for Electricity Metering, published by Edison Electric Institute. This authoritative guide provides extensive explanations of many aspects of metering, from fundamentals of how meters and instrument transformers operate, to meter testing, wiring, and installation.