AMAZON multi-meters discounts AMAZON oscilloscope discounts
1. Introduction
As the demand for, and societal dependence upon, electricity has grown, so too have the complexities of maintaining ever-growing transmission and distribution systems. From its inception in the late 1800s to today, the electric grid has undergone a significant growth, both in its geographic reach and transfer capability.
With this increasing demand came the need of longer distances for that electricity to be transmitted, due to the siting of large power-generating facilities away from major load centers. This required the development of higher voltages and ampacities, achieved through technological advances in the field of electric power transmission equipment, construction, and design. Longer transmission line distances were also driven by the interconnection of neighboring utility systems, which provided the key benefit of reliability through reserve sharing.
All of this, over time, has led to a change in the concept or definition of "transmission." Voltages, which might have once been considered "transmission" level are now commonplace for local distribution and subtransmission systems.
Today, typical extra high voltage (EHV) transmission line voltages in the United States are 765, 500, and 345 kV. Other common voltage classes utilized as transmission are 230, 161, 138, 115, and 69 kV. Many utilities differ in their definitions of what transmission is defined as. Per FERC Order 743, the bulk electric system has been defined as "greater than 100 kV"; thus, many entities will now use that definition for transmission. Some companies also use the term "subtransmission" as an intermediate level between distribution and transmission. In the western United States, 500, 345, and 230 kV make up the larger inter connection backbone, whereas 69-161 kV are typical voltage levels for local-area transmission systems.
In general, transmission line reliability is a greater concern than for distribution lines, since transmission substations typically serve as the source for delivering power to the subtransmission and/or distribution system from a variety of resources. Also, as mentioned previously, transmission typically connects multiple utility systems together, allowing for a more efficient, cost-effective, and reliable system. Along with this is also the fact that greater amounts of power, and thus customers, are at risk for every trans mission outage or contingency. The existing NERC Transmission Planning (TPL) standards reflect this concept, as it does not allow for the loss of load when a single transmission element encounters an outage.
However, the NERC standards are not the initiating force behind the need to study outage performance. Transmission reliability concerns have been integral to power system planning since the inception of the lines themselves. Factors such as design, weather performance, common mode outages, and outage performance of lines are key facets of the overall design and specification of electrical systems.
Empirical data gathering and analysis are a necessary component of ensuring ongoing reliability and safety of systems. Engineers inherently seek to have a rule-of-thumb for a variety of issues; compiling outage data over time aids that continuous effort, helping to learn from mistakes and institute improvements over time.
2. Common Terminology for Analyzing
Transmission Outage Data
One of the key issues when discussing data of any sort is the adherence to a specific set of definitions which is commonly understood. In the electric power industry, the majority of statistical/probabilistic analysis is focused on distribution system related outages. However, IEEE Standard 8591 has definitions for power transmission. This standard was recently reaffirmed in 2008. Some of the basic definitions and how they are calculated are included hereafter.
In-service state: The component or unit is energized and fully connected to the system.
Outage state: The component or unit is not in the in-service state; that is, it is partially or fully isolated from the system.
Reporting period time: The duration of the reporting period (equals service time plus outage time).
Service time: The accumulated time one or more components or units are in the in-service state during the reporting period.
Outage time: The accumulated time one or more components or units are in the outage state during the reporting period.
Outage duration: The period from the initiation of an outage occurrence until the component or unit is returned to the in-service state.
Outage rate: The number of outage occurrences per unit of service time = # of outage occurrences/ service time.
Availability = Service time/reporting period time.
Unavailability = Outage time/reporting period time.
3. Transmission Outage Data Sources and Current Data Gathering Efforts
The following list identifies transmission outage data gathering efforts throughout North America:
ECAR, the former regional reliability organization known as East Central Area Reliability, had a continuous data collection until after the 2004 data collection. ECAR gathered automatic and nonautomatic outage data. This data collection was halted in anticipation of the NERC TADS efforts.
The Canadian Electric Association or CEA has been gathering transmission circuit and transformer outage information since 1978. Canadian Electric Association gathers outage data for transmission lines but also for transformers, circuit breakers, cables, shunt reactors and capacitors, series capacitors, and static and synchronous compensators. The outage reports are available if a member of the CEA.
The MAPP, Mid-Continent Area Power Pool, did data collection in the 1970s and 1980s and helped in the development of common definitions and measures.
The WECC TRD, Western Electricity Coordinating Council, Transmission Reliability Database, development began with data collection in 2006. The WECC TRD data gathering is active and will be further explained in the next sections.
The NERC TADS, North American Electricity Corporation, Transmission Availability Database System, first year of data collection was 2008. The NERC TADS data gathering is active and will be further explained in the next sections FIG. 1.
4. Western Electricity Coordinating
Council: Transmission Reliability Database
The WECC TRD was developed as a result of the PBRC, probabilistic-based reliability criteria-development in the late 1990s and creation of the workgroup called the RPEWG-reliability performance evaluation work group.
Data gathered for the WECC TRD are automatic outages for transmission elements greater than 200 kV. The data for nonautomatic/manual outages are not gathered, as these outages were deemed within WECC as having no benefit.
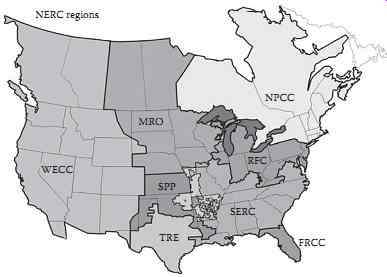 FIG. 1 NERC regions.
The members of WECC wanted to incorporate probabilistic planning into the WECC planning criteria and process instead of simply just deterministic methods. Because of this approach, the PBRC was developed to define the limits and expectations of outage frequency. From this process, outage frequency rates were developed for the NERC Table I outage categories. This is for the contingency Categories of A, B, C, and D. Based on these outage frequency rates; transmission facilities within WECC were then expected to perform at that rate for the outage category.
Within WECC, there has been a long-enduring criterion for two transmission circuits in a common corridor. This criterion within WECC states that for two circuits within the stated definition of a common corridor that these two circuits are to be held to the NERC Category C performance requirements as well as more stringent WECC requirements. This is to be considered a Category C contingency.
Because this common corridor criterion is more stringent than NERC standard performance requirements, there was a process developed within WECC to allow for an exemption for two corridor circuits from the more stringent requirements that met certain requirements for the exemption. This exemption process is called the PCUR or performance category upgrade request.
There are two main aspects of a PCUR; the first being robust line design or proving that the design of the potentially exempted line is more robust per certain criteria listed in the documents accompanying the robust line design process, and the second by showing proof that the circuits in the corridor will or do have an expected outage rate that is more reliable than the outage rate listed in the WECC criteria for this contingency. Therefore, the two circuits in the common corridor need to show outage MTBF greater than the listed rate of 0.033-0.33. The transmission owner that is requesting the PCUR needs to show that the outage frequency is greater than one in 30 years.
The TRD was developed to assist this process in two ways. The first to develop a database that potential PCUR transmission owners will have a database developed that can be used for typical or similar corridor outage rates for newly constructed or planned corridors. The second reason is to give the RPEWG the data it needs to follow or track the performance of existing corridors to monitor the performance relative to the outage rate. Also, to have a performance track of those exempted corridors, to ensure they are performing to expected values.
The assignment of developing the TRD began in the early 2000s, and the work on development of the database began in early 2004 and was formally accepted by the WECC in 2006. The data submittal of 2006 was the first year of TRD data submittal. As of this writing, there have been four TRD annual reports with data analyzed each year more and more to try and get to more meaningful results from the data submittal (TABLE 1).
The following tables are compiled from data listed in the WECC TRD report. The current or latest year's data is listed as well as the average of the past four submittals.
The focus of the outage statistics in the TRD reports:
WECC transmission totals, momentary outage summary, sustained outage summary, outages per month, sustained transformer outage rate, transformer age summary, outage rate per bank by trans former age, outage rate of common corridor and common tower, outage rate per each physical attribute, voltage level outage cause code.
The focus of the TRD is to gather data of elements >200 kV and to focus on the physical design aspects of transmission circuits and transformers. This focus will allow a cooperation or coordination of all WECC members if particular equipment is seen to be failing at one TO or subregion and to give warning to other part of WECC of these failures. Each year outage rates are calculated for the number of overhead ground wires, conductors per phase, type of insulator, structure material, structure type, water rain type, elevation range. These results are shared in the WECC TRD report each year. Each year the RPEWG is developing different techniques to allow the witness of a systemic problem to convey to all of WECC.
The WECC TRD is a voluntary data submittal. But in 2009, 100% of WECC TOs submitted their data.
This is due to the NERC TADS which is a mandatory data submittal and the WECC has designed the TRD data submittal to cover both data submittals of the WECC TRD and NERC TADS.
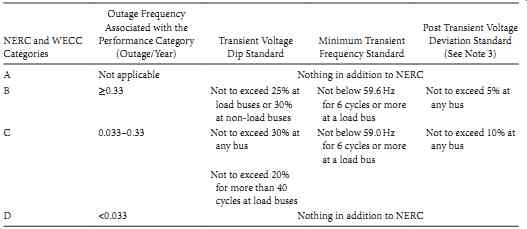
TABLE 1 WECC Disturban-Performance Table of Allow Able Effects on Other
Systems
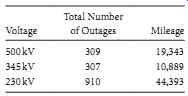
TABLE 2 2009 WECC TRD Data
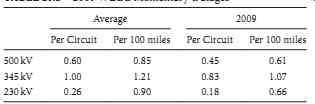
TABLE 3 2009 WECC Momentary Outages
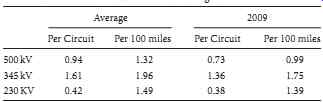
TABLE 4 2009 WECC Sustained Outages
From TABLE 2, we see that WECC is predominantly a 230 and 500 kV system with 1500-1600 outages per year across the entire WECC system.
In TABLE 3, the momentary outages are calculated for the WECC system and compared to the trailing year's data shown as average values. The values show that the system indices improved in 2009.
TABLE 4 shows the sustained outage rates for the WECC system. The values show that the system indices improved in 2009 versus the average values.
5. North American Electricity Reliability Corporation: Transmission Availability Database System
NERC TADS was started on the premise that transmission availability data will help to quantify NERC transmission system performance and reliability. NERC has taken the role of being an independent source of reliability performance information, a recommendation of the April 2004 United States- Canada power system outage task force report on the August 14, 2003 Blackout. The TADS task force was initiated in October 2006 to write the approach for transmission outage data reporting and measuring availability and performance. This became the NERC TADS.
NERC TADS collects outage data on specific lines while supplying utility aggregate transmission population information. NERC TADS will be implemented in two phases: Phase I is the collection of automatic outages began with the year 2008 data, Phase II adds the requirement of supplying the automatic outages as well as the nonautomatic outages for the calendar year. The first year of the nonautomatic outage data collection will be for the data collection of calendar year 2010.
The focus of the reporting in the TADS Reports:
There are a total of nine reports; there are NERC-wide and eight regional reports for each of the regions listing summary of NERC-wide results, all AC circuit metrics, all DC circuit metrics, all transformer metrics, and AC/DC back-to-back converter metrics.
The data structure for TADS will gather aggregate transmission population from the TOs while gathering specific data for each outage.
The purpose of TADS is to provide outage cause analysis and outage Event analysis. Event analysis will aid the in the determination of credible contingencies and will results in better understanding, and this understanding should be used to improve planning and operations.
In addition, trending each Regional Entity's performance against its own history will show that region's performance is changing over time. Given the vast physical differences between regions and TOs (weather, load density, geography, growth rate, system age, customer mix, impact of significant events, average circuit mileage, etc.), we believe that comparisons for the purposes of identifying relative performance between regions are not appropriate. Taken from the NERC TADS revised final report, September 26, 2007.
5.1 Data in Annual Reports
The data listed in Tables 5 and 6 shows the results for all of NERC for 2009. The numbers for the columns are total circuit outage frequency (TCOF), sustained circuit outage frequency (SCOF), and momentary circuit outage frequency (MCOF). More information can be found at www.nerc.com.
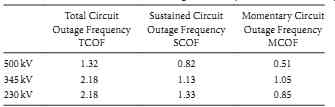
TABLE 5 2009 NERC Wide Outage Summary
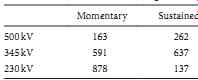
TABLE 6 NERC 2009 Outage Totals
6. Salt River Project Transmission Outage Data
What is Salt River Project (SRP)? SRP is a municipal electric power and water utility that serves the Phoenix, AZ metropolitan area.
The SRP system has
Line Parameters-Mileage, Rating, and Other Data 500 kV (Overhead pole miles) 357 230 kV (Overhead pole miles) 411 115 kV (Overhead pole miles) 264 69 kV (Overhead pole miles) 903 69 kV (Underground miles) 8
The SRP bulk transmission and subtransmission system consist of facilities and electrical equipment in the 500, 230, 115, and 69 kV voltage classes.
6.1 SRP Operating Environment
In order to reliably serve its customer load, SRP addresses specific design challenges associated with its operating environment. For example, temperatures in the Phoenix metro area can range from 20°F to 122°F. Due to high cooling needs, SRP's system peak load occurs annually during the summer after several hot days in a row with temperatures above 115°F. In order to address the extreme weather operating conditions, SRP designs its transmission in a manner that prevents thermal overloading of equipment during peak demand periods. Therefore, SRP's transmission system is highly reliable due to the development of an overall system design architecture, equipment specification, maintenance, and planning and operational standards. In order to present evidence that SRP's transmission system designs, operating and maintenance practices are adequate to meet the environmental demands, SRP measures its trans mission reliability performance by collecting and analyzing transmission disturbance event data.
6.2 Transmission Event Data Capture
A transmission event or disturbance is defined as an abnormal system condition that may include electric system faults, equipment outages, frequency deviations, voltage sags, etc. Because SRP captures the data in the context of the event, the data quality is excellent and operations personnel are made aware of system events that may influence current and near-term system operations.
6.3 Transmission Event Data Characteristics
Transmission event data can be broadly classified into two distinct categories. One is a set of "random" events that represent environmental impacts regardless of the system design, maintenance, and operations. These random events contribute approximately 75% of the total annual transmission event count.
The other category is classified as "nonrandom" events and is directly related to the system design, maintenance, and operation practices. Annual event counts of transmission system are very low com pared to distribution system event counts. Current reliability reporting practices comingle random and nonrandom events in such a manner to often provide management with misleading information.
6.4 Nonrandom Event Performance Analysis of Actionable
Transmission System Events
NREP represents a new reliability reporting and analysis concept that seeks to separate actionable information from random transmission event data. The underlying aspect of NREP is that electric utilities design their systems to perform in the environment in which they are expected to operate. NREP analysis differentiates transmission event data that reflects the fidelity of a transmission design, maintenance, and operating practices to the data that does not.
6.5 Potential Uses of the Nonrandom Event Performance, NREP, Feedback
Each utility uses a list of outage cause codes that the outages of the system are charged into for collection and, if necessary, more intense data scrutiny. SRP uses the following outage cause codes in that all 69 kV through 500 kV outage will be categorized.
6.6 Category Random
Animals, vehicle caused, bird contact, contamination, customer caused, debris in equipment, environ mental condition, fire, foreign system, unknown with fault, inadvertent by public, lightning, rain, storm with unknown cause, unknown with no fault, vandalism, and wind.
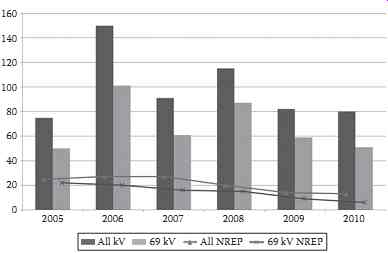
FIG. 2 The SRP system NREP.
6.7 Category Nonrandom
AC circuit equipment, breaker failure, communications, control, relay, EMS failure, inadvertent by SRP, unmitigated distribution fault, under-built line, shunt capacitor or reactor failure, power system condition, pole failure, series capacitor failure, AC substation equipment failure, vegetation or transformer failure.
There are three things that can be done from the feedback, do nothing, change maintenance spending, or change design. The feedback from NREP can give a better idea of how to proceed, if desired.
If the system shows a downward trending NREP, then the maintenance dollars could be potentially decreased to save money and to allow the NREP to raise enough to be within acceptable limits. How to define the acceptable limits? If the system shows an upward trending NREP, then the time for maintenance spending increases is now or soon depending on how close to acceptable limits.
Maintenance spending is a quicker feedback mechanism for the NREP because design changes may take many, many years to see the influence because the existing system is very large given that the design changes will have impact over time as system is added.
In FIG. 2, the SRP system NREP is shown for the past 6 years. The vertical bars represent all outages and the horizontal lines are the NREP values. The NREP value is shown to be decreasing.
Also, only a small percentage of the total customer outages are transmission caused but there is always the possibility of transmission outage cascading, leading to multiple outages that may cause large scale customer outages or system-wide outages. Therefore, transmission outages may not be a great influence on customer outages normally, but the possibility always exists for this to turn large scale and regional.
Transmission outage data can serve the utility in the following ways:
1. Demonstrating the design, maintenance, and operational practices that meet or exceed the challenges posed by the environment
2. If the practices need to be changed to increase reliability
3. If improvements are needed operationally
Typically, SRP experiences four to six 69 kV line outages each year caused by an inadvertent action by SRP personnel. In 2008, SRP experienced 16 of these outages. There were two main causes that can be attributed to the increase. In 2008, relay maintenance revised their maintenance practices to include exercising inputs and outputs on relays. Also, at this time, three times the normal number of relays was upgraded in the first half of the year that contributed to this high number of outages. These practices were changed after 6 months and the outage rates returned to normal. The number of inadvertently caused outages returned to a typical value, 2 total, in 2009.
The number of transmission initiated outages versus the number of distribution caused customer outages:
2009 38/7343 = 0.5%
2008 86/8152 = 1.05%
2007 85/7908 = 1.08%
2006 114/7763 = 1.46%
2005 54/8133 = 0.66%
6.8 NREP Conclusion Section
NREP transmission event data analysis conveys the system's reliability of how well the system reacts to its environment. NREP provides an easily understood model to demonstrate to the stakeholders whether the system is performing adequately or not. Additionally, NREP analysis can provide a frame work that enables a true utility to utility reliability performance comparison.
7. Southern California Edison Transmission Outage Data
Southern California Edison (SCE) is one of the largest electric utilities in the United States, providing electric service to nearly 14 million people throughout a 50,000 square mile service territory. The service territory is quite diverse geographically, exposing it to a variety of different climates. SCE has been gathering transmission outage data for 50-plus years. A summary of SCE's transmission and subtransmission line mileages as of 2010 is provided hereafter.
Line Mileages (approx)
500 kV (Overhead lines) 1031
230 kV (Overhead lines) 3379
230 kV (Underground lines) 1
115 kV (Overhead lines) 1874
115 kV (Underground lines) 16
66 kV (Overhead lines) 4838
66 kV (Underground lines) 254
SCE's system design philosophy differs in two key ways from other utilities. First, SCE utilizes a radial design. All loads at any "A-station" (see squares in the following diagram) serve load on lower voltages (i.e., subtransmission systems) radially, meaning the lower voltage levels (i.e., 66 and 115 kV) are not net worked to other transmission stations during normal operation. Another way to think of this is that the subtransmission system is not operated electrically parallel to the transmission system. SCE is a participating transmission owner within the California Independent System Operator (CAISO), and thus the CAISO has operational control of the SCE transmission system. The majority of subtransmission and distribution systems SCE owns are still under the operational control of SCE. SCE follows this design philosophy since the original system development. This is due to the simplicity it brings in operating, planning, and designing subtransmission systems. Second, SCE is a large importer of electricity from outside the service territory, significantly depending on the EHV transmission system to import energy throughout the western United States ( FIG. 3).
Due to this slightly different philosophy and being a large importer of power with a vast and geo graphically diverse service territory, SCE requires a higher level of reliability from its transmission system. Rather than solely looking at the aggregate statistics, SCE's planning engineers focus their attention on ascertaining which outages are more frequent(or credible), by annually evaluating the outage data. This is in addition to availability reports and other regulatory obligations that SCE submits data to NERC, WECC, CAISO, and the state of California.
SCE Number of transmission circuit initiated customer outages versus the number of distribution circuit initiated customer outages:
2010 2/15,900 = 0.01% 2009 1/14,042 = 0.01% 2008 12/14,780 = 0.08% 2007 0/15,801 = 0.00% 2006 0/17,580 = 0.00%
SCE experiences a significant amount of 500 kV outages every year due to wildfires. As this is a common occurrence throughout its service territory annually, SCE criteria specify a separation of a third EHV circuit from any other two circuits within the same right-of-way. These criteria were developed due to the historical experience SCE had in the development of the Pacific AC Intertie lines.
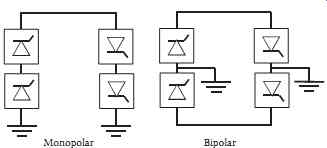
FIG. 3 Typical SCE electric system voltage classes.
Due to SCE's dependence on the EHV system, it is essential not to put more than two EHV circuits in corridors exposed to extreme conditions, such as fire. Allowing a separation of 2000 ft or more between circuits can address this issue. These criteria serve as an example of how long-term data gathering efforts can guide utilities in prudently planning for the nuances of their unique service territories.
8. Conclusion
While there is a significant amount of work that has been performed regarding transmission outage data, the authors foresee that this work will only increase in the future, due to the even greater importance of reliability on transmission systems. The computational abilities of today, compared to that of a few decades ago, will allow for even more variations of data analysis and interpretation.
By the use of outage data over time and the vigilant investigation of outages and properly written out age cause codes can lead to potential feedback to the power system design and potential changes to the design over time. There may be potential feedback to maintenance practices as well.
Through experience, one can glean that the statistics and probabilities alone will not tell the whole story; specific details on certain lines can typically be an important piece of the puzzle during event analysis. However, in order to evaluate any large sample of data, it is understood that one must use the methods used in the examples mentioned earlier in the section. However, the authors urge readers to be cognizant of the fact that data can be presented in ways that could mislead; thus, it is always beneficial to obtain more specific information when making significant decisions.
The authors would like to thank all those involved in the compilation of this section, specifically those at both SCE and SRP, and their families.