AMAZON multi-meters discounts AMAZON oscilloscope discounts
OVERVIEW
1. Electrical Stresses on External Insulation: Transmission Lines and Substations • Electrical Stresses • Environmental Stresses • Mechanical Stresses
2. Ceramic (Porcelain and Glass) Insulators: Materials • Insulator Strings • Post-Type Insulators • Long Rod Insulators
3. Nonceramic (Composite) Insulators: Composite Suspension Insulators • Composite Post Insulators
4. Insulator Failure Mechanism: Porcelain Insulators • Insulator Pollution • Effects of Pollution • Composite Insulators • Aging of Composite Insulators
5. Methods for Improving Insulator Performance
6. Accessories
Electric insulation is a vital part of an electrical power system. Although the cost of insulation is only a small fraction of the apparatus or line cost, line performance is highly dependent on insulation integrity. Insulation failure may cause permanent equipment damage and long-term outages. As an example, a short circuit in a 500 kV system may result in a loss of power to a large area for several hours. The potential financial losses emphasize the importance of a reliable design of the insulation.
The insulation of an electric system is divided into two broad categories:
1. Internal insulation
2. External insulation
Apparatus or equipment has mostly internal insulation. The insulation is enclosed in a grounded housing, which protects it from the environment. External insulation is exposed to the environment. A typical example of internal insulation is the insulation for a large transformer where insulation between turns and between coils consists of solid (paper) and liquid (oil) insulation protected by a steel tank. An overvoltage can produce internal insulation breakdown and a permanent fault.
External insulation is exposed to the environment. Typical external insulation is the porcelain insulators, supporting transmission line conductors. An overvoltage caused by flashover produces only a temporary fault. The insulation is self-restoring.
This section discusses external insulation used for transmission lines and substations.
Electrical Stresses on External Insulation
The external insulation (transmission line or substation) is exposed to electrical, mechanical, and environ mental stresses. The applied voltage of an operating power system produces electrical stresses. The weather and the surroundings (industry, rural dust, oceans, etc.) produce additional environmental stresses.
The conductor weight, wind, and ice can generate mechanical stresses. The insulators must withstand these stresses for long periods of time. It’s anticipated that a line or substation will operate for more than 20-30 years without changing the insulators. However, regular maintenance is needed to minimize the number of faults per year. The typical number of insulation failure-caused faults is 0.5-10 per year, per 100 mile of line.
--1.1 Transmission Lines and Substations
Transmission line and substation insulation integrity is one of the most dominant factors in power system reliability. We will describe typical transmission lines and substations to demonstrate the basic concept of external insulation application.
FIG. 1 shows a high-voltage transmission line. The major components of the line are:
1. Conductors
2. Insulators
3. Support structure tower
The insulators are attached to the tower and support the conductors. In a suspension tower, the insulators are in a vertical position or in a V-arrangement. In a dead-end tower, the insulators are in a horizontal position. The typical transmission line is divided into sections and two dead-end towers terminate each section. Between 6 and 15 suspension towers are installed between the two dead-end towers. This sectionalizing prevents the propagation of a catastrophic mechanical fault beyond each section. As an example, a tornado-caused collapse of one or two towers could create a domino effect, resulting in the collapse of many miles of towers, if there are no dead ends.
FIG. 2 shows a lower voltage line with post-type insulators. The rigid, slanted insulator supports the conductor. A high-voltage substation may use both suspension and post-type insulators. References give a comprehensive description of transmission lines and discuss design problems.
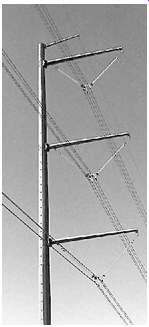
Above: FIG. 1 A 500 kV suspension tower with V string insulators.
--1.2 Electrical Stresses
The electrical stresses on insulation are created by
1. Continuous power frequency voltages
2. Temporary overvoltages
3. Switching overvoltages
4. Lightning overvoltages
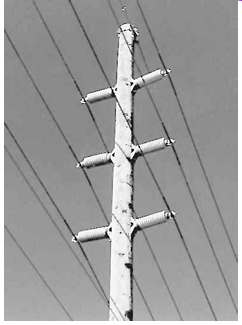
Above: FIG. 2 69 kV transmission line with post insulators.
--1.2.1 Continuous Power Frequency Voltages
The insulation has to withstand normal operating voltages. The operating voltage fluctuates from changing load. The normal range of fluctuation is around ±10%. The line-to-ground voltage causes the voltage stress on the insulators. As an example, the insulation requirement of a 220 kV line is at least
This voltage is used for the selection of the number of insulators when the line is designed. The insulation can be laboratory tested by measuring the dry flashover voltage of the insulators. Because the line insulators are self-restoring, flashover tests don’t cause any damage. The flashover voltage must be larger than the operating voltage to avoid outages. For a porcelain insulator, the required dry flashover voltage is about 2.5-3 times the rated voltage. A significant number of the apparatus standards recommend dry withstand testing of every kind of insulation to be two (2) times the rated voltage plus 1 kV for 1 min of time. This severe test eliminates most of the deficient units.
===
TABLE --1 Expected Amplitude of Temporary Overvoltages
Type of Overvoltage | Expected Amplitude | Duration
Fault overvoltages Effectively grounded 1.3 per unit 1 s Resonant grounded 1.73 per unit or greater 10 s Load rejection System substation 1.2 per unit 1-5 s Generator station 1.5 per unit 3 s Resonance 3 per unit 2-5 min Transformer energization 1.5-2.0 per unit 1-20 s
===
--1.2.2 Temporary Overvoltages
Ground faults, switching, load rejection, line energization, or resonance generates relatively long duration power frequency or close to power frequency overvoltages. The duration is from 5 s to several minutes. The expected peak amplitudes and duration are listed in Table --1.
The base is the crest value of the rated voltage. The dry withstand test, with two times the maximum operating voltage plus 1 kV for 1 min, is well-suited to test the performance of insulation under temporary overvoltages.
===
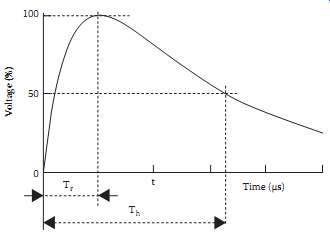
Above: FIG. 3 Switching overvoltages. Tr = 20-5000 µs, Th < 20,000 µs,
where Tr is the time-to-crest value and Th is the time-to-half value.
===
--1.2.3 Switching Overvoltages
The opening and closing of circuit breakers causes switching overvoltages. The most frequent causes of switching overvoltages are fault or ground fault clearing, line energization, load interruption, interruption of inductive current, and switching of capacitors.
Switching produces unidirectional or oscillatory impulses with durations of 5,000-20,000 µs. The amplitude of the overvoltage varies between 1.8 and 2.5 per unit. Some modern circuit breakers use pre insertion resistance, which reduces the overvoltage amplitude to 1.5-1.8 per unit. The base is the crest value of the rated voltage.
Switching overvoltages are calculated from computer simulations that can provide the distribution and standard deviation of the switching overvoltages. FIG. 3 shows typical switching impulse voltages. Switching surge performance of the insulators is determined by flashover tests. The test is performed by applying a standard impulse with a time-to-crest value of 250 µs and time-to-half value of 5000 µs. The test is repeated 20 times at different voltage levels and the number of flashovers is counted at each voltage level. These represent the statistical distribution of the switching surge impulse flashover probability. The correlation of the flashover probability with the calculated switching impulse voltage distribution gives the probability, or risk, of failure. The measure of the risk of failure is the number of flashovers expected by switching surges per year.
--1.2.4 Lightning Overvoltages
Lightning overvoltages are caused by lightning strikes:
1. To the phase conductors
2. To the shield conductor (the large current-caused voltage drop in the grounding resistance may cause flashover to the conductors [back flash])
3. To the ground close to the line (the large ground current induces voltages in the phase conductors) Lighting strikes cause a fast-rising, short-duration, unidirectional voltage pulse. The time-to-crest value is between 0.1 and 20 µs. The time-to-half value is 20-200 µs.
The peak amplitude of the overvoltage generated by a direct strike to the conductor is very high and is practically limited by the subsequent flashover of the insulation. Shielding failures and induced volt ages cause somewhat less overvoltage. Shielding failure-caused overvoltage is around 500-2000 kV. The lightning-induced voltage is generally less than 400 kV. The actual stress on the insulators is equal to the impulse voltage.
The insulator basic insulation level (BIL) is determined by using standard lightning impulses with a time-to-crest value of 1.2 µs and time-to-half value of 50 µs. This is a measure of the insulation strength for lightning. FIG. 4 shows a typical lightning pulse.
When an insulator is tested, peak voltage of the pulse is increased until the first flashover occurs.
Starting from this voltage, the test is repeated 20 times at different voltage levels and the number of flashovers is counted at each voltage level. This provides the statistical distribution of the lightning impulse flashover probability of the tested insulator.
--1.3 Environmental Stresses
Most environmental stress is caused by weather and by the surrounding environment, such as industry, sea, or dust in rural areas. The environmental stresses affect both mechanical and electrical (M&E) performance of the line.
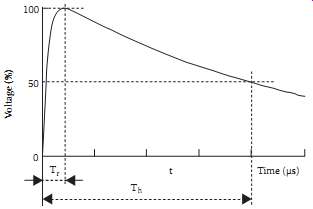
Above: FIG. 4 Lightning overvoltages. Tr = 0.1-20 µs, Th = 20-200 µs, where
Tr is the time-to-crest value and Th is the time-to-half value.
--1.3.1 Temperature
The temperature in an outdoor station or line may fluctuate between -50°C and +50°C, depending upon the climate. The temperature change has no effect on the electrical performance of outdoor insulation. It’s believed that high temperatures may accelerate aging. Temperature fluctuation causes an increase of mechanical stresses; however, it’s negligible when well-designed insulators are used.
--1.3.2 UV Radiation
UV radiation accelerates the aging of non-ceramic composite insulators, but has no effect on porcelain and glass insulators. Manufacturers use fillers and modified chemical structures of the insulating material to minimize the UV sensitivity.
--1.3.3 Rain
Rain wets porcelain insulator surfaces and produces a thin conducting layer most of the time. This reduces the flashover voltage of the insulators. As an example, a 230 kV line may use an insulator string with 12 standard ball-and-socket-type insulators. Dry flashover voltage of this string is 665 kV and the wet flashover voltage is 502 kV. The percentage reduction is about 25%.
Non-ceramic polymer insulators have a water-repellent hydrophobic surface that reduces the effects of rain. As an example, with a 230 kV composite insulator, dry flashover voltage is 735 kV and wet flashover voltage is 630 kV. The percentage reduction is about 15%. The insulator's wet flashover voltage must be higher than the maximum temporary overvoltage.
--1.3.4 Icing
In industrialized areas, conducting water may form ice due to water-dissolved industrial pollution. An example is the ice formed from acid rain water. Ice deposits form bridges across the gaps in an insulator string that result in a solid surface. When the sun melts the ice, a conducting water layer will bridge the insulator and cause flashover at low voltages. Melting ice-caused flashover has been reported in the Quebec and Montreal areas.
===
TABLE --2 Site Severity (IEEE Definitions) Description ESDD (mg/cm2 ) Very light 0-0.03 Light 0.03-0.06 Moderate 0.06-0.1 Heavy <0.1
===
TABLE --3 Typical Sources of Pollution
Pollution | Type | Source of Pollutant Deposit Characteristics Area
Rural areas Soil dust High resistivity layer, effective rain washing Large areas Desert Sand Low resistivity Large areas Coastal area Sea salt Very low resistivity, easily washed by rain 10-20 km from the sea Industrial Steel mill, coke plants, chemical plants, generating stations, quarries High conductivity, extremely difficult to remove, insoluble Localized to the plant area Mixed Industry, highway, desert Very adhesive, medium resistivity Localized to the plant area
===
--1.3.5 Pollution
Wind drives contaminant particles into insulators. Insulators produce turbulence in airflow, which results in the deposition of particles on their surfaces. The continuous depositing of the particles increases the thickness of these deposits. However, the natural cleaning effect of wind, which blows loose particles away, limits the growth of deposits. Occasionally, rain washes part of the pollution away.
The continuous depositing and cleaning produces a seasonal variation of the pollution on the insulator surfaces. However, after a long time (months, years), the deposits are stabilized and a thin layer of solid deposit will cover the insulator. Because of the cleaning effects of rain, deposits are lighter at the top of the insulators and heavier at the bottom. The development of a continuous pollution layer is compounded by chemical changes. As an example, in the vicinity of a cement factory, the interaction between the cement and water produces a tough, very sticky layer. Around highways, the wear of car tires produces a slick, tar-like carbon deposit on the insulator's surface.
Moisture, fog, and dew wet the pollution layer, dissolve the salt, and produce a conducting layer, which in turn reduces the flashover voltage. The pollution can reduce the flashover voltage of a standard insulator string by about 20%-25%.
Near the ocean, wind drives salt water onto insulator surfaces, forming a conducting salt-water layer, which reduces the flashover voltage. The sun dries the pollution during the day and forms a white salt layer. This layer is washed off even by light rain and produces a wide fluctuation in pollution levels.
The equivalent salt deposit density (ESDD) describes the level of contamination in an area. ESDD is measured by periodically washing down the pollution from selected insulators using distilled water. The resistivity of the water is measured and the amount of salt that produces the same resistivity is calculated.
The obtained mg value of salt is divided by the surface area of the insulator. This number is the ESDD. The pollution severity of a site is described by the average ESDD value, which is determined by several measurements.
Table --2 shows the criteria for defining site severity.
The contamination level is light or very light in most parts of the United States and Canada. Only the sea shores and heavily industrialized regions experience heavy pollution. Typically, the pollution level is very high in Florida and on the southern coast of California. Heavy industrial pollution occurs in the industrialized areas and near large highways. Table --3 gives a summary of the different sources of pollution.
The flashover voltage of polluted insulators has been measured in laboratories. The correlation between the laboratory results and field experience is weak. The test results provide guidance, but insulators are selected using practical experience.
--1.3.6 Altitude
The insulator's flashover voltage is reduced as altitude increases. Above 1500 ft, an increase in the number of insulators should be considered. A practical rule is a 3% increase of clearance or insulator strings' length per 1000 ft as the elevation increases.
--1.4 Mechanical Stresses
Suspension insulators need to carry the weight of the conductors and the weight of occasional ice and wind loading.
In northern areas and in higher elevations, insulators and lines are frequently covered by ice in the winter. The ice produces significant mechanical loads on the conductor and on the insulators. The trans mission line insulators need to support the conductor's weight and the weight of the ice in the adjacent spans. This may increase the mechanical load by 20%-50%.
The wind produces a horizontal force on the line conductors. This horizontal force increases the mechanical load on the line. The wind-force-produced load has to be added vectorially to the weight-produced forces. The design load will be the larger of the combined wind and weight, or ice and wind load.
The dead-end insulators must withstand the longitudinal load, which is higher than the simple weight of the conductor in the half span.
A sudden drop in the ice load from the conductor produces large-amplitude mechanical oscillations, which cause periodic oscillatory insulator loading (stress changes from tension to compression and back).
The insulator's 1 min tension strength is measured and used for insulator selection. In addition, each cap and-pin or ball-and-socket insulator is loaded mechanically for 1 min and simultaneously energized. This M&E value indicates the quality of insulators. The maximum load should be around 50% of the M&E load.
The Bonneville Power Administration uses the following practical relation to determine the required M&E rating of the insulators:
1. M&E > 5 * Bare conductor weight/span
2. M&E > Bare conductor weight + Weight of 3.81 cm (1.5 in.) of ice on the conductor (3 lb/ft^2 )
3. M&E > 2 * Bare conductor weight + Weight of 0.63 cm (1/4 in.) of ice on the conductor and loading from a wind of 1.8 kg/ft^2 (4 lb/ft^2 )
The required M&E value is calculated from all equations above and the largest value is used.
=====
Ball Steel pin Insulating glass or porcelain Cement Compression loading Ball socket Iron cap Locking key Insulator's head Expansion layer Imbedded sand Skirt Petticoats Corrosion sleeve for DC insulators
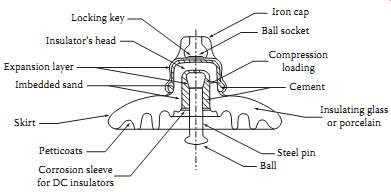
Above: FIG. 5 Cross section of a standard ball-and-socket insulator.
=====
TABLE --4 Technical Data of a Standard Insulator
Diameter 25.4 cm (10 in.)
Spacing 14.6 cm (5-3/4 in.)
Leakage distance 305 cm (12 ft)
Typical operating voltage 10 kV
Mechanical strength 75 kN (15 klb)
====
Ceramic (Porcelain and Glass) Insulators
--2.1 Materials
Porcelain is the most frequently used material for insulators. Insulators are made of wet, processed porcelain. The fundamental materials used are a mixture of feldspar (35%), china clay (28%), flint (25%), ball clay (10%), and talc (2%). The ingredients are mixed with water. The resulting mixture has the consistency of putty or paste and is pressed into a mold to form a shell of the desired shape. The alternative method is formation by extrusion bars that are machined into the desired shape. The shells are dried and dipped into a glaze material. After glazing, the shells are fired in a kiln at about 1200°C. The glaze improves the mechanical strength and provides a smooth, shiny surface. After a cooling-down period, metal fittings are attached to the porcelain with Portland cement. Reference [3] presents the history of porcelain insulators and discusses the manufacturing procedure.
Toughened glass is also frequently used for insulators [4]. The melted glass is poured into a mold to form the shell. Dipping into hot and cold baths cools the shells. This thermal treatment shrinks the surface of the glass and produces pressure on the body, which increases the mechanical strength of the glass. Sudden mechanical stresses, such as a blow by a hammer or bullets, will break the glass into small pieces. The metal end fitting is attached by alumina cement.
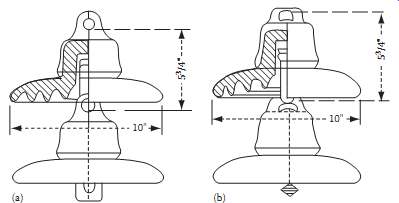
Above: FIG. 6 Insulator string: (a) clevis type and (b) ball-and-socket type.
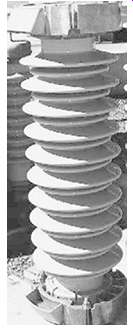
Above: FIG. 7 Standard and fog-type insulators. (Sediver, Inc., Nanterre, France.)
===
TABLE --5 Typical Number of Standard (5-1/4 ft × 10 in.)
Insulators at Different Voltage Levels Line Voltage (kV) | ) Number of Standard Insulators
===
--2.2 Insulator Strings
Most high-voltage lines use ball-and-socket-type porcelain or toughened glass insulators. These are also referred to as "cap and pin." The cross section of a ball-and-socket-type insulator is shown in FIG. 5.
Table --4 shows the basic technical data of these insulators.
The porcelain skirt provides insulation between the iron cap and steel pin. The upper part of the porcelain is smooth to promote rain washing and cleaning of the surface. The lower part is corrugated, which prevents wetting and provides a longer protected leakage path. Portland cement attaches the cup and pin. Before the application of the cement, the porcelain is sandblasted to generate a rough surface. A thin expansion layer (e.g., bitumen) covers the metal surfaces. The loading compresses the cement and provides high mechanical strength.
The metal parts of the standard ball-and-socket insulator are designed to fail before the porcelain fails as the mechanical load increases. This acts as a mechanical fuse protecting the tower structure.
The ball-and-socket insulators are attached to each other by inserting the ball in the socket and securing the connection with a locking key. Several insulators are connected together to form an insulator string. FIG. 6 shows a ball-and-socket insulator string and the clevis-type string, which is used less frequently for transmission lines.
Fog-type, long leakage distance insulators are used in polluted areas, close to the ocean, or in industrial environments. FIG. 7 shows representative fog-type insulators, the mechanical strength of which is higher than standard insulator strength. As an example, a 6 1/2 × 12 1/2 fog-type insulator is rated to 180 kN (40 klb) and has a leakage distance of 50.1 cm (20 in.).
Insulator strings are used for high-voltage transmission lines and substations. They are arranged vertically on support towers and horizontally on dead-end towers. Table --5 shows the typical number of insulators used by utilities in the United States and Canada in lightly polluted areas.
Above: FIG. 8 Post insulators.
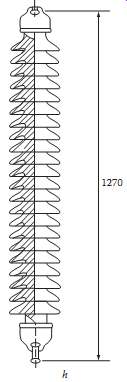
Above: FIG. 9 Long rod insulator.
--2.3 Post-Type Insulators
Post-type insulators are used for medium- and low-voltage transmission lines, where insulators replace the cross-arm ( FIG. 3). However, the majority of post insulators are used in substations where insulators support conductors, bus bars, and equipment. A typical example is the interruption chamber of a live tank circuit breaker. Typical post-type insulators are shown in FIG. 8.
Older post insulators are built somewhat similar to cap-and-pin insulators, but with hardware that permits stacking of the insulators to form a high-voltage unit. These units can be found in older stations.
Modern post insulators consist of a porcelain column, with weather skirts or corrugation on the outside surface to increase leakage distance. For indoor use, the outer surface is corrugated. For outdoor use, a deeper weather shed is used. The end-fitting seals the inner part of the tube to prevent water penetration. FIG. 8 shows a representative unit used at a substation. Equipment manufacturers use the large post-type insulators to house capacitors, fiber-optic cables and electronics, current transformers, and operating mechanisms. In some cases, the insulator itself rotates and operates disconnect switches.
Post insulators are designed to carry large compression loads, smaller bending loads, and small ten sion stresses.
--2.4 Long Rod Insulators
The long rod insulator is a porcelain rod with an outside weather shed and metal end fittings. The long rod is designed for tension load and is applied on transmission lines in Europe. FIG. 9 shows a typical long rod insulator. These insulators are not used in the United States because vandals may shoot the insulators, which will break and cause outages. The main advantage of the long rod design is the elimination of metal parts between the units, which reduces the insulator's length.