AMAZON multi-meters discounts AMAZON oscilloscope discounts
[Note: various equations denoted by "e." are not yet avail., but coming soon.]
1. Introduction to Electrical Shock
The effects of electric currents flowing through a human body vary from little or no perceptible effect, to the sensation of shock, to severe injury or death by electrocution. The effect of the current flow is a function of magnitude and duration of the current. The magnitude, by Ohm's law, depends on the applied voltage divided by the electrical impedances of the body and other available current paths. The chances that an electric current will exceed the level necessary for human or animal perception increase with contact duration and the voltage and decrease with the impedance of the body.
Greater time duration of exposure results in heating of body tissues, with the attendant physical damage and destruction. Because the human body impedance is nonlinear, voltage is a significant consideration in determining whether or not an energized object will have the ability to deliver current through a body. As with human body impedances, the effects of electrical shock on the human body are essential in the design of inherently safe electrical systems.
Modeling the response of the human body to electrical stimuli is a complex task. In the simplest model, two types of impedances are used: (i) skin and (ii) internal. The skin is a layered structure, with both resistance and capacitance. The resistance is nonlinear in voltage and time. The impedance of the interior is largely resistive, comparable to a similar volume of saline at human body concentration.
Different types of internal tissue, muscle, and bone will have differing electrical characteristics, which must be taken into account. The skin capacitance causes impedance to decrease with frequency, as AC current shunts the high skin resistance.
Data on human and animal body electrical resistance under various conditions is widely available in the literature, and consists of both original research and numerous compilations of data for various applications. The most detailed combination of original research with a literature survey is in Reilly (Reilly, 1998).
Power line effects are discussed in (IEEE, Working Group on Electrostatic and Electromagnetic Effects, 1978), while substation grounding has its own standard (IEEE, 2000). Agricultural stray voltages are analyzed in (USDA, 1991), with the main emphasis being on cattle, but including a Section on effects on humans. Residential concerns, especially swimming pools, are discussed in an EPRI guidebook for technicians investigating complaints of shocking (EPRI, 1999) and a technical brief on swimming pools (EPRI, 2000). Major papers on electrical shock hazards and their effects by C.F. Dalziel (Dalziel and Lee, 1969) (Dalziel, 1972) and R.H. Lee (Lee, 1971), presented much of the important data still used today. Kouwenhoven conducted important research at John's Hopkins University on electric shocks from the 1930s through the 1950s. Electrical safety information is also compiled in the IEEE Yellow Book (IEEE, 1998), and the Electrical Safety Handbook (Cadick, Capelli-Schellpheiffer, and Neitzel, 2000). A very useful standard, which provides compilations of much important data, is provided in IEC 60479-1 (IEC, 2005). The UL Standard C101 (UL, 2002) on Leakage Current for Appliances provides some current limits and test methods.
A key consideration with energized objects is that in order for electric current to flow through the body, the body must become part of an electrical circuit. This Section supplies considerable detail on how currents can pass though different parts of the body and each parameter that can impede or limit that flow of current. For example, the same person touching an energized object may experience a shock if they were barefoot and may not if they were wearing tennis shoes. Similarly, the perception would be minimized if the skin were dry instead of wet, and further; there would be a different perception if the contact mode were "foot-to-foot" versus "hand-to-foot" or "hand-to-hand." The following Section provides a very detailed description of the physiological effects of currents on the human body and details the conditions that pose the greatest dangers for severe shock and/or electrocution.
The information presented indicates that the most likely scenarios for a dangerous condition would be that when a human subject comes in contact with an energized metallic object and the subject is barefoot, and the ground is moist or wet as are the subject's hands and or feet.
The hazards may be less under other conditions, such as a dry day, rubber- or leather-soled shoes, or dry hands, but are not eliminated.
2. Human and Animal Sensitivities to Electric Current
Human sensitivity to electric current is classified in an increasing scale dependent on current magnitude and duration. Table 1 lists some of the experimental results from the literature for the following exposure levels.
[coming soon] Table 1 Current Thresholds (mA) for 60 Hz Exposure
Perception levels are based on touch or grip of dry skin. Perceptions levels do not present a danger under normal circumstances.
Startle currents do not produce harmful effects in themselves, but can cause injury due to reactions, such as fear and sudden movements.
This is the level used to set leakage current standards for appliances and power tools. The 0.5 mA UL leakage current standards for appliances (UL, 2002) are set below the reaction currents.
The let-go current threshold is the point beyond which the subject can no longer release their grasp on a conductor. Currents above this level cause involuntary muscle contractions. If the current level is decreased, the person will be able to release their grasp, and may suffer no ill effects.
Respiratory paralysis (or respiratory tetanus) can be produced by prolonged exposure to currents at the let-go current threshold and above. Respiratory paralysis can cause severe pain, exhaustion, and death from asphyxiation.
Some reports indicate that currents as little as 50% above the let-go current threshold produce difficulty in breathing.
Ventricular fibrillation is a stoppage of the heart caused by electric current. It is usually fatal within a few minutes, and is the most severe consequence of electric shock. The current necessary to produce fibrillation is related to exposure time by an I2T constant (Dalziel and Lee, 1969), the so-called electrocution equation:
eq.1
…where: I = current in amperes
t = exposure time in seconds, and
K = electrocution constant.
Using animal data, Lee and Dalziel extrapolated values for constant K at 0.5% percentiles for 50 kg adults and 18 kg children (Figure 1). This represents 67-107 mA for 3 s for adults and 30-40 mA for children. The data is valid over a range of 0.083 (5 cycles @ 60 Hz) to 5 s (300 cycles @ 60 Hz). At the minimum time, the current range is 403-642 mA for adults and 180-240 mA for children.
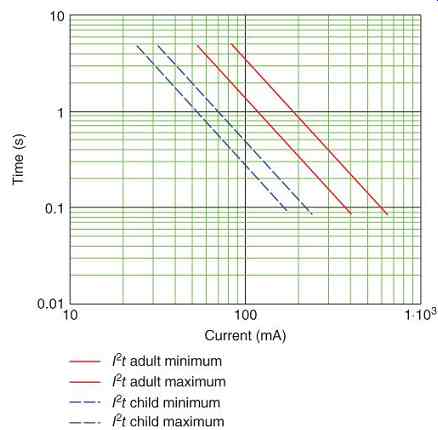
Fig. 1 Electrocution threshold current ranges for 0.5% percentile of 50
kg adults (solid) and 18 kg children (dashed).
Heart paralysis and severe burning can result from higher currents than necessary to cause fibrillation. At these high currents, fibrillation may not occur, or may be reversed.
3. Human Body Impedance
The impedance of the human body can be broken down into the impedances of the various body parts, resulting in an equivalent circuit for the electrical path through the body.
The various components are indicated in Figures 2 and 3. Human body impedance is characterized as that of a bulk medium, which combines the elements of inductance, resistance, and capacitance in one solid.
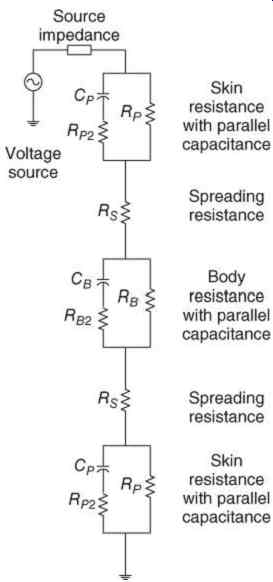
Fig. 2 Human body impedance components.
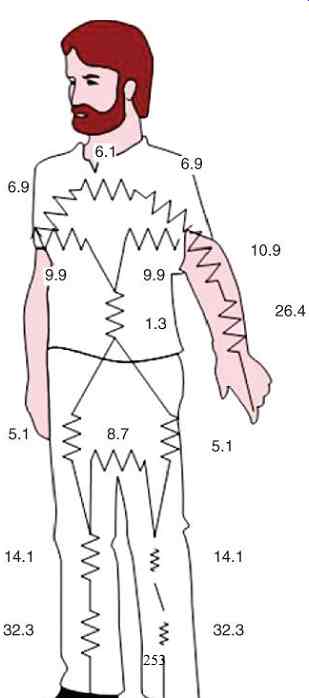
Fig. 3 Human body impedance percentages.
The skin resistance is dependent on the portion of the body (thicker or thinner skin), the wetness of the skin, and the area and pressure of contact. Skin resistance is divided into two parts, the surface layer resistance, , in parallel with the capacitance and the spreading resistance . The spreading resistance covers the zone where the current spreads out into the body from the contact area. Skin resistivity is in a range of 60-1200 kOhm-cm^2 (Reilly, 1998, p. 27). Skin resistance decreases with time of contact. After approximately 20 min, the resistivity of dry and wet skin becomes equal, at about 2/3 of the wet skin resistivity.
Skin is also subject to dielectric breakdown at an applied voltage between 150 and 250 V, and at as low as 50 V for exposures lasting several minutes. Considering the area of a foot as 200 cm^2, the skin resistance of a single foot ranges from 0.3 to 6 kOhm. The skin capacitance varies from 0.02 to 0.06 µF/cm^2 (Reilly, 1998, p. 280). The resistance in series with the skin capacitance, , is often neglected, while the parallel resistance, , is the steady-state impedance.
The internal body impedance is usually divided into regions, each of which is assigned a percentage of the total (Reilly, 1998, pp. 37-41), as shown in Figure 4. The resistance of the various body parts is proportional to the bulk resistance of an equal size and shape of saline solution with a resistivity of 80 O-cm. On this basis, the impedance of children is larger than that of adults.
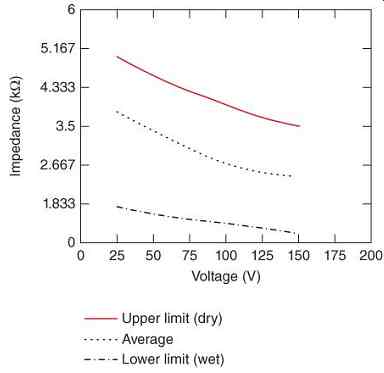
FIG. 4 Total body impedance ranges for hand-to-hand or hand-to-foot contacts.).
Statistical rankings of adult total body impedance given by the IEC (IEC, 2005) are shown in Table 2. For a typical 125 V exposure, the 5th percentile is 1125 O, the 50th 1625 O, and the 95th 2875 O. These values are for hand-to-hand conduction with dry contacts.
Table 2 Adult Total Body Impedance (Ohm) Including Skin Resistance, at Power Frequencies for Contact of Large Surface Area, as a Function of Exposure Voltage
Hand to Foot Impedances are Given as 70% of Hand to Hand.
IEC (2005) Table 1.
The IEC results show impedance decreased by 10-25% for fresh water contacts, and by up to 50% for salt water. This effect is more pronounced at applied voltages less than 150 V.
Data on hand-to-foot and foot-to-foot contact shows these values are reduced by 10-30% (IEC, 2005 p. 31). The values shown in Table 2 are 70% of the hand-to-hand values.
Resistance to direct currents (DC) is higher than for alternating currents (AC) because the skin capacitance removes the parallel skin resistance from the circuit, as shown in Figure 2.
Skin impedance is the most complex component of human body impedance. In addition to the linear components shown in Figure 2, skin impedance is nonlinear with respect to both voltage and time. When skin is exposed to increasing current densities over time, the properties of the skin itself will change (IEC, 2005, p. 29). These are divided by the IEC into four zones, ranging from no alterations (Zone 0) through carbonization (Zone 3), and plotted as a current density versus time curves.
The upper limit of Zone 0 is 10 mA/cm2 at 5 s to about 5 mA/cm2 in the steady state. Skin resistance will decrease with time of exposure, leveling off after 20-30 min (Reilly, 1998, pp. 29-31). Short-term variations may result in distortion of sinusoidal current waveforms.
The Stevens equation (Reilly, 1998, p. 29) describes the nonlinear voltage-direct current relationship in dry skin as 6.2 The nonlinearity becomes dominant above the range of 2-4 V. Above 450 to 1000 V, skin breakdown becomes significant. The parallel resistance was found to be the major source of nonlinearities, which is expected from Stevens' DC results.
4. Effects of Various Exposure Conditions
4.1 Bare Feet, Wet Conditions, and Other Variations
Resistance of footwear has a considerable impact on total body resistance. Typical shoe resistances (Lee, 1971 Figure 1) are 5-10 kOhm for wet leather soles and 100-500 kOhm for dry.
Rubber soles have resistances of over 20 M-Ohm.
Skin resistance will decrease by as much as 50% under wet conditions. This is particularly significant when barefoot contact is made.
Comparison of a number of tests (Reilly, 1998) shows decreases in resistance being much greater at voltages less than 125 V. The resistance is less with saline as opposed to tap water.
The effect of pressure, for instance a hand holding a pipe, is also to decrease the resistance. For example, a dry palm touch will have a resistance of 3-8 k-Ohm, while a hand grasp of a 1.5 in. pipe will have a resistance of 1-3 k-Ohm.
These values are reduced to 1-2 k-Ohm and 0.5-1.5 k-Ohm, respectively, under wet conditions.
Human body impedance, as illustrated in Figure 4, varies with applied voltage (Reilly, 1998, pp. 36-37). This nonlinearity is mainly due to skin impedance, and so varies with wetness and contact area. This data can be fit to an exponential function:
eq.3
... where ...
= kOhm, V in volts and , , and = constants.
4.2 Shoes and Other Insulated Objects and the Earth
The resistance of the earth can be calculated assuming the foot is a conducting disk (IEEE, 2000, p. 20). The usual assumption is of a 0.08 m radius and a footprint area of 200 cm2. The resistance of one footprint is:
eq.4
…where…
= resistivity of the material and
= radius of the footprint.
If the surface material is in a thin layer, additional de-rating factors apply. The contact resistance for a single foot varies from approximately 100 Ohm to 3 kOhm for concrete and 75 Ohm to 3 MOhm for gravel. These values can be compared with a typical 1 kOhm for the human body (neglecting footwear).
5. Current Paths Through the Body
The pathways electric current takes through the body are extremely dependent on the points of contact. The most dangerous pathways involve the heart. Tests using a current transformer around the heart of a cadaver (Reilly, 1998, p. 41) whose results are summarized in Table 3 show an average of 6.7% and a maximum of 8.5% of total current passed through the heart for right hand-to-feet conduction. For foot-to-foot conduction, the average was negligible, while the maximum was 0.4%.
Similar results were found in tests on dogs. It could be assumed that current pathways through the body similarly affect respiratory paralysis. The IEC shows a heart-current factor where the current from left hand to either or both feet is taken as 100% (Table 4). The heart current required to cause damage is a function of time, as will be discussed in a later section. Experimental results on animal hearts show variation with electrode area and placement as well (Reilly, 1998, pp. 230-237).
A current flowing vertically (hand to foot) is more likely to cause fibrillation than the same current flowing horizontally (hand to hand).
Very little fibrillating current flows through the heart for foot-to-foot contacts.
=============
Table 3 Typical Ranges of Current Which Flow Through the Heart
=========
Table 4 IEC Heart-Current Factor
Current Path Heart-Current Factor Left hand to feet 1.0 Hand to hand 0.4 Right hand to feet 0.8 Foot to foot 0.02 Head to foot 0.8 IEC (2005), Table 12.
=======
Body size relationships are different for fibrillating current than for shocking current (Reilly, 1998, pp. 220-225). One conclusion favored by researchers is that fibrillation depends on current density in the heart, rather than the total current magnitude. A current flowing through a child would have greater current density in the heart than the same current in an adult, and thus be more likely to cause fibrillation. However, as a child's impedance can be up to four times greater than an adult, the total current through a child would be less than an adult for exposure to the same voltage.
Electrical current is applied to the heart when an automatic electric defibrillator (AED) is used. Defibrillation is performed by applying a series of high current pulses, with magnitudes of several amperes, to a wide area of the heart.
This synchronized stimulation can reverse the effects of fibrillation if performed within a short time after the onset of fibrillation.
A model (Figure 5) of human body impedance was constructed, based on Reilly (1998, p. 40).
A typical foot-to-foot human body resistance of 802 Ohm is assumed. With a 120 V, 60 Hz source and 200 Ohm of footing resistance, the current through the victim is 0.12 A. This is just at or above the threshold of fibrillation listed in Table 1. In the case where almost none of the current passes through the chest, the greater risk is of paralysis of the limbs. Tables 5-7 show how the resistances of various body parts can be estimated for use in the equivalent circuit. Figure 6 shows an equivalent circuit based on the resistances for hand-to-foot conduction in Table 5. Figure 7 shows an equivalent circuit based on the resistances for foot-to-foot conduction in Table 6.
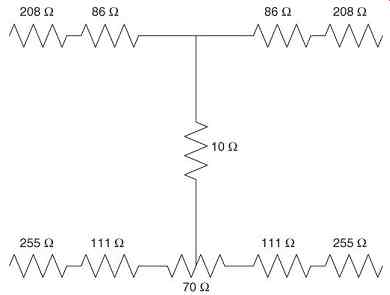
FIG. 5 Circuit model of human body based on the fifth percentile of hand-to-foot
conduction.
========
Table 5 Typical Ranges of Resistance (Ohm) for Hand to Foot Conduction
Name % Ohm 5th Percentile 50th Percentile 95th Percentile Fore arm 26.4 208 300 [...]
==========
Table 6 Typical Ranges of Resistance (Ohm) for Foot to Foot Conduction
=========
Table 7 Typical Ranges of Resistance (Ohm) for Hand to Hand Conduction
========
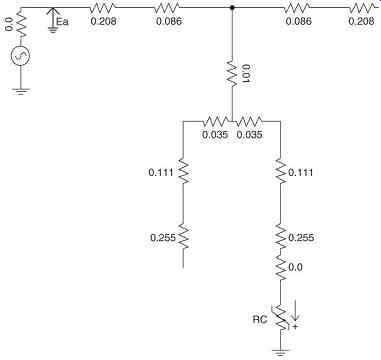
FIG. 6 Hand-to-foot conduction, resistances in kilowatts. RC represents
the variable earth resistance. Note that the current flows through the torso.).
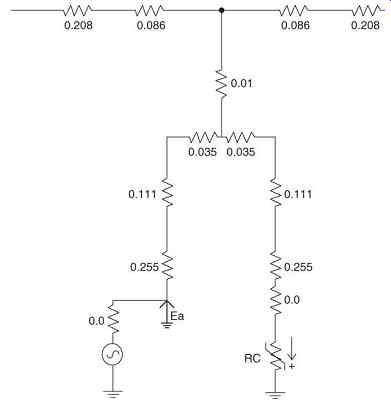
FIG. 7 Foot-to-foot conduction, resistances in kilowatts. RC represents
the variable earth resistance. Note that current flow does not go through the
heart.).
Calculated current values are shown in Table 8 for bare feet. Current values calculated for any type of footwear show no risk of shock or fibrillation. With bare feet, risk of respiratory tetanus is present in the currents in bold, on concrete, and wet salt gravel. There will be some perception of a shock on wet fresh gravel as well. Table 9 shows the same calculations for hand-to-foot conduction, with the expected results of lower current levels. The lower current levels must be balanced against the fact that a hand-to-foot current path has greater chance of passing through the heart, and thus a smaller current could pose a greater risk.
==========
Table 8 Contact Resistance of a Single Bare Foot and Calculated Foot to Foot Current
=========
Footprint radius assumed to be 8 cm. Two shoes with one on a conducting medium were assumed.
Table 9 Contact Resistance of a Single Bare Foot and Calculated Hand to Foot Current Footprint radius assumed to be 8 cm. Two shoes with one on a conducting medium were assumed.
6. Human Response to Electrical Shock Varies with Exposure Conditions, Current Magnitude, and Duration
The electrocution equation (1) is a simplified time exposure factor for electrical shock. The IEC (IEC, 2005, p. 51) defines several zones, beginning with a reversibility zone of muscular contractions (AC-3, 0.5 mA line b to curve c1), followed by zones where the probability of ventricular fibrillation (PVF) is less than 5% (AC-4-1, between curves c1 and c2), between 5% and 50% (AC-4-2, between curves c2 and c3), and greater than 50% (AC-4-3, above curve c3).
These are based on a current path of left hand to both feet. The IEC curves can be expressed mathematically as follows:
b: lower limit of reversibility zone of muscular contractions [...]
The comparison with the electrocution equation (1) is shown in Figure 8. The IEC curves provide a roughly similar standard.
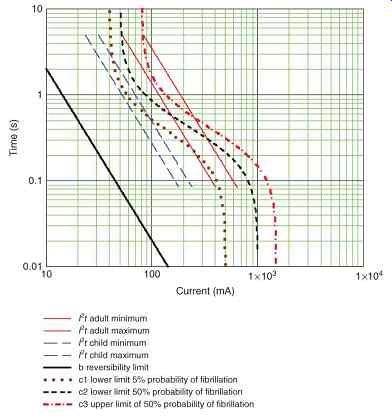
FIG. 8 Comparison of I2t curves from the electrocution equation with
IEC fibrillation curves (b, c1, c2, and c3).
The IEC curves can be adjusted by the heart factors to produce shifted curves for different exposure types as shown in Figures 9- 12.
These show that the fibrillation time thresholds are longer for other types of contact. Lower levels of currents also have time duration thresholds. For example, the magnitude of the sensation produced by an electric field can become painful if it is applied for 16 half-cycles, but is not felt at 4 half-cycles (Reilly, 1998, p. 264).
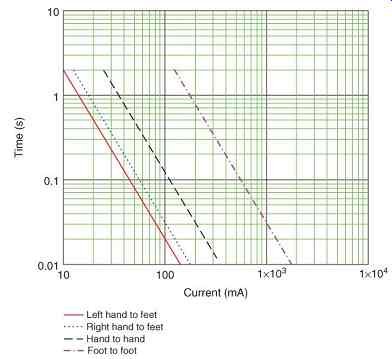
FIG. 9 IEC damage curve b (reversible disturbances) adjusted by IEC heart-current
factor for various current paths.
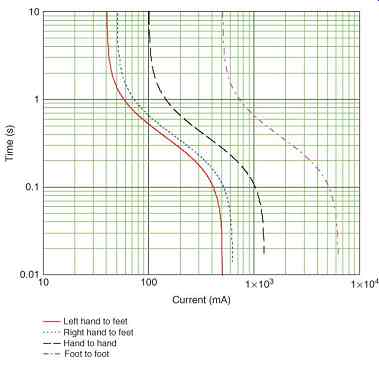
FIG. 10 IEC fibrillation curve c1 (lower limit of 5% probability) adjusted
by IEC heart-current factor for various current paths.
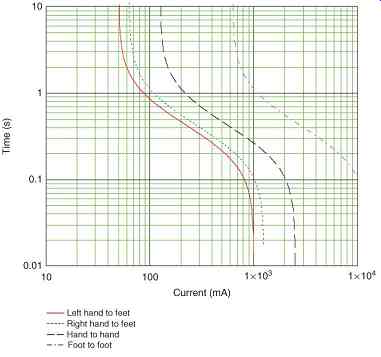
FIG. 11 IEC fibrillation curve c2 (upper limit of 5% probability and lower
limit of 50% probability) adjusted by IEC heart-current factor for various
current paths.
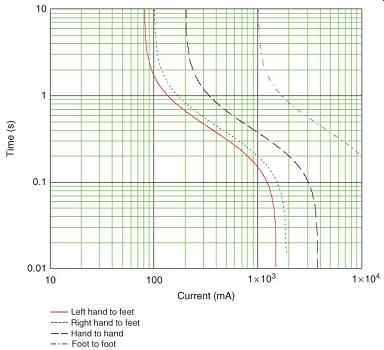
FIG. 12 IEC fibrillation curve c3 (upper limit of 50% probability) adjusted
by IEC heart-current factor for various current paths.
7. Medical Imaging and Simulations
Further investigation of electrical shock effects would help to more precisely characterize risks and improve electrical safety.
Bio-electromagnetism is an established area of research. Electrical impedance tomography (EIT) (Skipa, Sachse, and Dössel, 2000) is a medical imaging procedure where electrical currents are applied to the body and the voltage drop measured at other locations. Images are reconstructed using by solving inverse nonlinear field equations. Finite element method (FEM) models have been constructed for EIT, electrocardiography (ECG), and other bioelectric procedures (Pursula et al., 2000).
Magnetic resonance imaging (MRI) has also been proposed to visualize the flow of electrical currents within the body (Ozbek et al., 2001).
The flow of current within the body during an electrical shock has been simulated (Freschi et al., 2013) for comparison with the current distributions in the IEC standards. These and similar models have be used for analyzing electrical injuries and the effectiveness of safety procedures and equipment. The FEM takes into account the volume impedance of each organ, volume currents, and the effects of electric and magnetic fields. Coupled with this are medical imaging techniques developed for cardiac monitoring that can measure and trace electrical currents within the body in three dimensions.