AMAZON multi-meters discounts AMAZON oscilloscope discounts
...
1 Introduction
The insatiable demand for smaller lightweight portable electronic equipment has dramatically increased the need for research on battery chemistries as well as the semiconductor components required for the optimal management of the batteries. Estimated worldwide sales for rechargeable batteries, also known as secondary batteries, was around U.S. $36 billion in 2008, and this is expected to grow toward U.S. $51 billion by 2013. As per market reports, U.S. demand for primary and secondary batteries will increase 2.5% annually to 16.8 billion in 2012, while primary batteries will account for 5.8 billion with a growth rate of 3%.
Mature rechargeable battery chemistries are (a) lead acid, (b) nickel cadmium, (c) nickel metal hydride, (d) lithium ion, (e) lithium polymer/lithium metal, and (f) lithium iron phosphate. With the demand growing from electric vehicles and portable consumer products, many organizations spend huge amounts of research money on new battery chemistries. Some significant areas include zinc-based chemistries and silicon as a material for improving some properties of batteries (3). Higher energy density, superior cycle life, environmental friendliness, and safe operation are among the general design targets of secondary battery manufacturers. Primary or disposable batteries are a reasonably mature market and a product chemistry range, but still there are attempts to increase the energy density, reduce self-discharge rate (to increase the shelf life), and also to improve the usable temperature range. To complement these developments many semiconductor manufacturers continue to introduced new integrated circuit families for battery management.
This Section describes the characteristics of battery families such as sealed lead acid, NiCd, NiMH, Li-based chemistries, rechargeable alkaline, and zinc-air together with modern techniques used in battery management ICs, without elaborating on the battery chemistries. Concepts and applications related to smart battery systems and related standards, and IEEE 1625/1725 standards for safety of battery-powered systems are also briefly introduced.
2 Battery Terminology
2.1 Capacity
Battery or cell capacity means an integral of current over a defined period of time.
Capacity i dt
This equation applies to either charge or discharge; that is, capacity added or capacity removed from a battery or cell. The capacity of a battery or cell is measured in milliampere hours (mAh) or ampere-hours (Ah).
Although the basic definition is simple, many different forms of capacity are used in the battery industry. The distinctions between them reflect differences in the conditions under which the capacity is measured.
2.1.1 Standard Capacity
Standard capacity measures the total capacity that a relatively new, but stabilized production cell or battery can store and discharge under a defined standard set of application conditions.
It assumes that the cell or battery is fully formed, that it’s charged at standard temperature at the specification rate, and that it’s discharged at the same standard temperature at a specified standard discharge rate to a standard end-of-discharge voltage (EODV). The standard EODV is itself subject to variation depending on discharge rate as discussed.
2.1.2 Actual Capacity
When the application conditions differ from standard, the capacity of the cell or battery changes. The term actual capacity includes all nonstandard conditions that alter the amount of capacity the fully charged new cell or battery is capable of delivering when fully discharged to a standard EODV. Examples of such situations might include subjecting the cell or battery to a cold discharge or a high-rate discharge.
2.1.3 Available Capacity
That portion of actual capacity that can be delivered by the fully charged new cell or battery to some nonstandard EODV is called available capacity. Thus if the standard EODV is 1.6 V per cell, the available capacity to an EODV of 1.8 V per cell would be less than the actual capacity.
2.1.4 Rated Capacity
Rated capacity is defined as the minimum expected capacity when a new, but fully formed, cell is measured under standard conditions. This is the basis for C rate (defined later) and depends on the standard conditions used, which may vary depending on the manufacturer and the battery type.
2.1.5 Retained Capacity
If a battery is stored for a period of time following a full charge, some of its charge will dissipate. The capacity that remains that can be discharged is called retained capacity.
2.2 C Rate
The C rate is defined as the rate in amperes or milliamperes numerically equal to the capacity rating of the cell given in ampere-hours (Ah) or milliampere-hours (mAh). For example, a cell with a 1.2 Ah capacity has a C rate of 1.2 A. The C concept simplifies the discussion of charging for a broad range of cell sizes since the cells' responses to charging are similar if the C rate is the same. Normally an 8 Ah cell will respond to a 0.8 A (0.1 C) charge rate in the same manner that a 2 Ah cell will respond to a 0.2 A (also 0.1 C) charge rate. The rate at which current is drawn from a battery affects the amount of energy that can be obtained. At low discharge rates the actual capacity of a battery is greater than at high discharge rates. This relationship is shown in FIG. 1.
2.3 Energy Density
Energy density of a cell is its energy divided by its weight or volume. When weight is used it’s called the gravimetric energy density, and volumetric energy density when the volume is used. The terms energy density and specific energy are sometimes used for volumetric and gravimetric measures respectively.
2.4 Power Density of a Battery
Power density is the amount of power a battery can deliver per unit volume at specified state of charge (SOC), usually 20%. It’s also called the volumetric power density and usually measured in watts per liter.
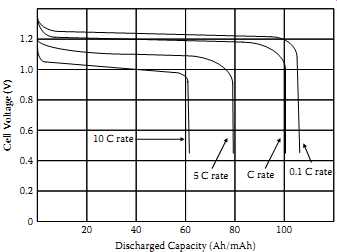
FIG. 1 Capacity versus discharge rate of a typical cell. Cell Voltage (V);
Discharged Capacity (Ah/mAh)
2.5 Cycle Life
Cycle life is a measure of a battery's ability to withstand repetitive deep discharging and recharging using the manufacturer's cyclic charging recommendations and still provide minimum required capacity for the application. Cyclic discharge testing can be done at any of various rates and depths of discharge to simulate conditions in the application. It must be recognized, however, that cycle life has an inverse logarithmic relationship to depth of discharge.
2.6 Cyclic Energy Density
For purposes of comparison, a better measure of rechargeable battery characteristics is a composite characteristic that considers energy density over the service life of the battery.
A composite characteristic, cyclic energy density, is defined as the product of energy density and cycle life at that energy density and has the dimensional units, watt-hour-cycles/ kilogram (gravimetric) or watt-hour-cycles/liter (volumetric).
2.7 Self-Discharge Rate
Self-discharge rate is a measure of how long a battery can be stored and still provide minimum required capacity and be recharged to rated capacity. This commonly is measured by placing batteries on a shelf stand at room (or elevated) temperature and monitoring open-circuit voltage over time. Samples are discharged at periodic intervals to determine remaining capacity and recharged to determine rechargeability.
2.8 Charge Acceptance
Charge acceptance is the willingness of a battery or cell to accept charge. This is affected by cell temperature, charge rate, and the state of charge.
2.9 Depth of Discharge
Depth of discharge (DOD) is the capacity removed from a battery divided by its actual capacity, expressed as a percentage.
2.10 Voltage Plateau
Voltage plateau is the protracted period of very slowly declining voltage that extends from the initial voltage drop at the start of a discharge to the knee of the discharge curve.
An example is shown for a lead-acid cell in FIG. 2.
2.11 Midpoint Voltage
Midpoint voltage is the battery voltage when 50% of the actual capacity has been delivered (see FIG. 2).
2.12 Overcharge
Overcharge is defined as continued charging of a cell after it has become fully charged.
When a cell is not yet fully charged, the electrical energy of the charge current is converted to chemical energy in the cell by the charging reactions. But when all of the available active material has been converted into the charged state, the energy available in the charging current goes to produce gases from the cell or to activate other nonuseful chemical reactions. Usually this results in a temperature rise in the cell.
2.13 State of Charge
State of charge (SOC) of a battery pack is defined as the percentage of the remaining charge (or remaining capacity (RC)) divided by its rated capacity (or the full charge capacity (FCC)). In other words it’s based on the cumulative sum of the daily charge/ discharge of the energy transfers, or simply the remaining percentage of the total ampere hour capacity of the battery.
===
Plateau Open Circuit Voltage Midpoint Voltage Knee of Discharge curve 50% 100% Discharged Capacity Discharged Voltage (V)
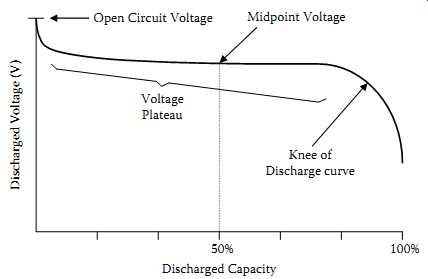
FIG. 2 Midpoint voltage and the voltage plateau.
===
3 Battery Technologies : An Overview
Most commonly available primary batteries (the disposable types) offer significantly greater energy density together with very low self-discharge rates. They are usually cheaper than the rechargeable batteries. Most common primary chemistries include (a) carbon-zinc (Leclanche cells), (b) alkaline-MnO2, (c) lithium-MnO2, (d) lithium sulfur dioxide, (e) lithium-iron disulphide, (f) lithium-thionyl chloride (LiSOCl2), (g) silveroxide, and (h) zinc-air. Mercury primary batteries have gradually gone out of the marketplace due to toxicity and environmental reasons.
===
TBL. 1 Secondary Battery Chemistry Characteristics
Parameter Units/Conditions Sealed Lead Acid NiCd NiMH Li-Ion Li-Polymer Li iron Phosphate Rechargeable Alkaline Average Cell Voltage Volts 2.0 1.2 1.2 3.6 1.8-3.0 3.2-3.3 1.5 Relative cost NiCd = 1 0.6 1 1.5-2.0 0.5 Internal resistance Low Very low Moderate High; High; High Self-discharge %/month 2%-4% 15%- 25% 20%- 25% 6%- 10% 18%- 20% 0.3% Cycle Life Cycles to reach 80% of rated capacity 500- 2000 500- 1000 500- 800 1000- 1200 1500- 2000
Overcharge tolerance High Med Low Very Low Med Energy by volume (volumetric energy density) Watt-hour/liter 70-110 100-150 200-350 200-330 230- 410 200 220 Energy by weight (gravimetric energy density) Watt-hour/kg 30-45 40-60 60-80 120-160 120-210 100 80
===
Many types of rechargeable chemistry are used in electronic systems. Common rechargeable chemistries are based on variations of lead-acid, nickel-based, and lithium based systems mainly, while limited zinc-based systems and rechargeable alkaline batteries are also available. The choice of a particular battery technology is limited by size, weight, cycle life, operating temperature range, and cost. A comparison of basic characteristics of major chemistries is depicted in TBL. 1.
===
TBL. 2 Energy Densities of Selected Fuels and Batteries
Fuel or Battery Volumetric Energy Density (Wh/kg) Diesel fuel 10,000 Methanol 5,000 High explosive 1,000 Primary battery (maximum estimated around 1995) 500 Rechargeable battery (maximum estimated around 1995) 200 LiSO2 battery 175 Alkaline battery 80 Ni-Cd battery 40 Li-ion battery 120.
===
NiCd batteries were used to power most rechargeable consumer appliances before 1990. It’s a mature, well-understood technology. However, cadmium is coming under increasing regulatory scrutiny (including mandatory recycling in some jurisdictions), and the maturity of NiCd technology also means most of the capacity and life cycle improvements have already been made. NiMH chemistry, which entered the market in 1989, offers incremental improvements in energy density by both weight and volume over NiCd. Li-ion is better still, offering over twice the watts per liter and per kilogram of NiCd batteries. As always, this higher performance comes at a higher price.
Using liquid lithium, Li-ion cells exhibit a much higher energy density than Ni-based chemistries, with a relatively higher terminal voltage than Ni-based cells, and is the commonly used energy source for most portable systems after 2000. The advantages of Li-ion chemistry, however, also come at the cost of greater electrical fragility. Li-ion particularly is more easily and extensively damaged by less than optimal battery management, so much so that fail-safe circuits are required to disconnect the cells from the load under overcurrent or overtemperature conditions. Therefore these electronic circuits are usually built into the battery pack.
In general, with an increase of the battery energy densities, and any possibilities of quantum jumps in new chemistries, one important concern is the safety and the transportability. TBL. 2 indicates the energy densities of selected fuels and batteries compared with high explosives with transportation capability. A value of 1000 Wh/kg energy density is essentially the practical maximum with its own oxidant for safe transportation. A conventional battery in general is having its own oxidant, similar to this situation, and therefore the maximums shown in the TBL. 2 apply in development options. However, this condition does not apply to metal air batteries, such as zinc-air and the like, since the oxidant is supplied by oxygen from the air.
With Li-based chemistries with high energy densities entering the market, and with some fires and explosions occurring in the past, Li battery manufacturers are not supposed to sell them to uncertified battery pack assemblers (BPAs), and strict charge and discharge control practices are in place.
During the last decade, newer lithium-based chemistries entered the market. Important ones are the Li-polymer (sometimes known as Li-ion polymer) and Li-iron phosphate chemistries, which have better performance than the Li-ion. Note that TBL. 1 is only a guide; for more precise details, individual manufacturer data sheets need to be consulted.
Lead-acid batteries are most familiar in automobiles because they are the most economical chemistry for delivering large currents. Lead acid also has a long trickle life and therefore serves well for classic "floating" applications. While flooded lead-acid technology is popular for automobile and similar applications, sealed lead-acid batteries serve the electronic engineering environments. On the downside, lead acid has the least capacity by volume and weight.
4 Lead-Acid Batteries
Lead-acid batteries are the oldest and most widely used rechargeable battery systems today, mostly due to the automotive industry's attachment to the lead-acid chemistry.
There are basically two types of lead-acid batteries, namely the (a) flooded lead-acid type and (b) sealed lead-acid type.
4.1 Flooded Lead-Acid Batteries
The flooded lead-acid battery today basically uses the design developed by Faure in 1881.
It consists of a container with multiple plates immersed in a pool of dilute sulfuric acid.
Recombination is minimal, so water is consumed through the battery life and the batteries can emit corrosive and explosive gases when experiencing overcharge. So-called "maintenance-free" forms of flooded batteries provide excess electrolyte to accommodate water loss through a normal life cycle. Most industrial applications for flooded batteries are found in motive power, engine starting, and large-system power backup.
Today, other forms of battery have largely supplanted flooded batteries in small- and medium-capacity applications, but in larger sizes flooded lead-acid batteries continue to dominate. By far, the biggest application for flooded batteries is starting, lighting, and ignition (SLI) service on automobiles and trucks. Large flooded lead-acid batteries also provide motive power for equipment ranging from forklifts to submarines and provide emergency power backup for many electrical applications, most notably the telecommunications network.
4.2 Sealed Lead-Acid Batteries
Sealed lead-acid batteries first appeared in commercial use in the early 1970s. Although the governing reactions of the sealed cell are the same as other forms of lead-acid batteries, the key difference is the recombination process that occurs in the sealed cell as it reaches full charge. In conventional flooded lead-acid systems, the excess energy from overcharge goes into electrolysis of water in the electrolyte with the resulting gases being vented. This occurs because the excess electrolyte prevents the gases from diffusing to the opposite plate and possibly recombining. Thus electrolyte is lost on overcharge with the resulting need for replenishment. The sealed lead-acid cell, like the sealed nickel-cadmium, uses recombination to reduce or eliminate this electrolyte loss.
Sealed lead-acid batteries for electronics applications are somewhat different from the type commonly found in the automobile. There are two types of sealed lead-acid batteries: the original gelled electrolyte and retained (or absorbed) system. The gelled electrolyte system is obtained by blending silica gel with an electrolyte, causing it to set up in gelatin form. The retained system employs a fine glass fiber separator to absorb and retain liquid electrolyte. Sometimes the retained system is named absorbed glass mat (AGM). AGM is also known in the industry as "starved design." Starved refers to the absorption limits of the glass separator creating a limitation to the AGM design relating to diffusion properties of the separator. In certain cases the AGM battery must be racked and trayed in a specific position for optimum performance. Both these types, gelled and AGM, are called valve-regulated lead-acid (VRLA) systems. Today, sealed lead-acid cells are operating effectively in many markets previously closed to lead-acid batteries. For a detailed account of lead-acid cells, (9-12) are suggested.
Meanwhile, some manufacturers have introduced special versions of sealed lead-acid batteries with higher volumetric energy density.
4.2.1 Discharge Performance of Sealed Lead-Acid Cells
The general shape of the discharge curve, voltage as a function of capacity (if the current is uniform) is shown in FIG. 2. The discharge voltage of the starved-electrolyte sealed lead-acid battery typically remains relatively constant until most of its capacity is discharged. It then drops off sharply. The flatness and the length of the voltage plateau relative to the length of the discharge are major features of sealed lead-acid cells and batteries. The point at which the voltage leaves the plateau and begins to decline rapidly is often identified as the knee of the curve.
Starved-electrolyte sealed lead-acid batteries may be discharged over a wide range of temperatures. They maintain adequate performance in cold environments and may produce actual capacities higher than their standard capacity when used in hot environments.
FIG. 3 indicates the relationships between capacity and cell temperature.
Actual capacity is expressed as a percentage of rated capacity as measured at 23ºC.
4.2.2 Capacity during Battery Life
The initial actual capacity of sealed lead-acid batteries is almost always lower than the battery's rated or standard capacity. However, during the battery's early life the actual capacity increases until it reaches a stabilized value, which is usually above the rated capacity. The number of charge-discharge cycles or length of time on float charge required to develop a battery's capacity depends on the specific regime employed.
Alternatively, if the battery is on charge at 0.1 C, it’s usually stabilized after receiving 300% (of rated capacity) overcharge. The process may be accelerated by charging and discharging at low rates.
Under normal operating conditions the battery's capacity will remain at or near its stabilized value for most of its useful life. Batteries will then begin to suffer some capacity degradation due to their age and the duty to which they have been subjected. This permanent loss usually increases slowly with age until the capacity drops below 80% of its rated capacity, which is often defined as the end of useful battery life. FIG. 4 shows a representation of the capacity variation with cycle life that can be expected from sealed lead-acid batteries.
4.2.3 Effect of Pulse Discharge on Capacity
In some applications, the battery is not called upon to deliver a current continuously.
Rather, energy is drawn from the battery in pulses. By allowing the battery to "rest" between these pulses, the total capacity available from the battery is increased. FIG. 5 represents typical curves representing the voltage delivered as a function of discharged capacity for pulsed and constant discharge at the same rate.
For the pulsed curve, the upper row of dots represents the open-circuit voltage, and the lower sawtooth represents the voltages during the periods when the load is connected.
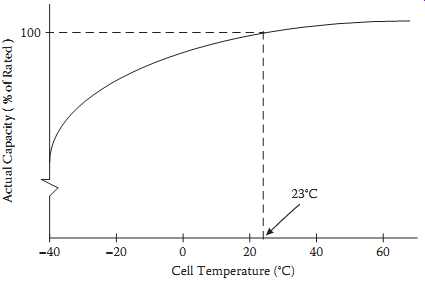
FIG. 3 Typical discharge capacity as a function of cell temperature.
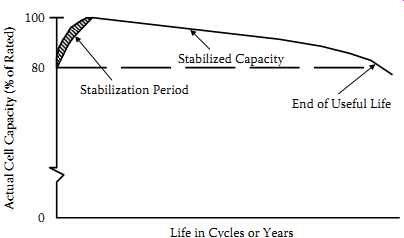
FIG. 4 Typical cell capacity during its life.
80 Stabilized Capacity Stabilization Period End of Useful Life
Life in Cycles or Years Actual Cell Capacity (% of Rated)
Constant Current Discharge at Pulse Application Rate Pulsed Discharge; Discharge Capacity Terminal Voltage Delivered
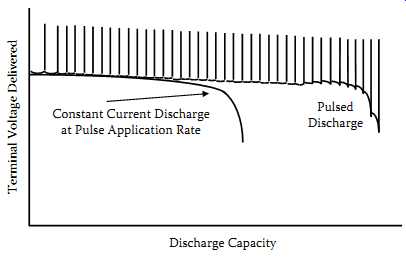
FIG. 5 Typical pulsed discharge curve.
The use of discharged capacity as the abscissa eliminates the rest periods and shows only the periods of useful discharge.
4.3 Charging
In general, experience with sealed lead-acid chemistry indicates that application problems are more likely to be caused by undercharging than by overcharging. Since the starved-electrolyte cell is relatively resistant to damage from overcharge, designers may want to ensure that the batteries are fully charged, even at the expense of some degree of overcharge. Obviously, excessive overcharge, in either magnitude or duration, should still be avoided.
The charge acceptance of sealed lead-acid batteries in most situations is quite high, typically greater than 90%. A 90% charge acceptance means that for every amp-hour of charge introduced into the cell, the cell will be able to deliver 0.9 Ah to a load. Charge acceptance is affected by a number of factors including cell temperature, charge rate, cell state of charge, age of the cell, and the method of charging.
The state of charge of the cell will dictate to some extent the efficiency with which the cell will accept charge. When the cell is fully discharged, the charge acceptance initially is quite low. As the cell becomes only slightly charged, it accepts current more readily and the charge acceptance jumps quickly, approaching 98% in some situations. The charge acceptance stays at a high level until the cell approaches full charge.
As mentioned earlier, when the cell becomes fully charged some of the electrical energy goes into generating gas, which represents a loss in charge acceptance. When the cell is fully charged, essentially all the charging energy goes to generate gas except for the very small current that makes up for the internal losses that otherwise would be manifested as self-discharge. A generalized curve representing these phenomena is shown in FIG. 6(a). As with most chemical reactions, temperature has a positive effect upon the charging reactions in the sealed lead-acid cell. Charging at higher temperatures is more efficient than it’s at lower temperatures, all other parameters being equal, as shown in FIG. 6(b).
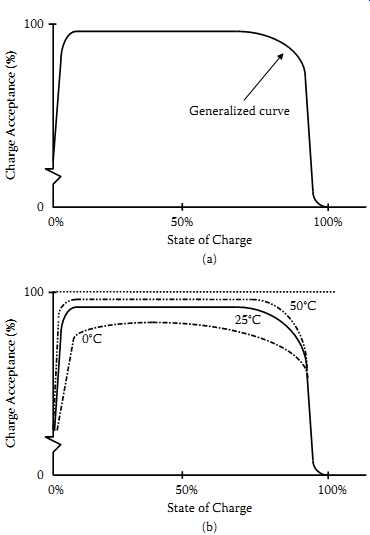
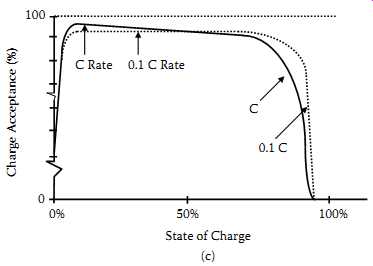
FIG. 6 Charge acceptance: (a) effect of state of charge upon charge acceptance;
(b) charge acceptance at various temperatures; (c) charge acceptance at various
charge rates.
The starved-electrolyte sealed lead-acid cell charges very efficiently at most charging rates. The cell can accept charge at accelerated rates (up to the C rate) as long as the state of charge is not so high that excessive gassing occurs. And the cell can be charged at low rates with excellent charge acceptance.
FIG. 6(c) shows the generalized curve of charge acceptance now further defined by charging rates. When examining these curves, one can see that at high states of charge, low charge rates provide better charge acceptance.
5 Nickel Cadmium (NiCd) Batteries
Sealed NiCd batteries are well suited to applications where a self-contained power source increases the versatility or reliability of the end product. Among the significant advantages of NiCd families are: higher energy density and discharge rates, fast recharge capability, long operating and storage life. This used to place NiCd families at the top of usage in the portable products. In addition, the NiCds are capable of operating over a wide temperature range and in any orientation with reasonable continuous overcharge capability.
5.1 Construction
NiCd secondary batteries operate at 1.2 V, using nickel oxyhydroxide for the active material in the positive electrode. The active material of the negative electrode consists of cadmium, while an alkali solution acts as the electrolyte. In NiCd batteries, a reaction at the negative electrode consumes the oxygen gas that generates at the positive electrode during overcharge. The design prevents the negative electrode from generating hydrogen gas, permitting a sealed structure. NiCd batteries mainly adopt cylindrical or prismatic type configurations. Because NiCd batteries contain cadmium, an environmentally hazardous substance, their disposal has become controversial. This has spurred research into other alternative chemistries.
5.2 Discharge Characteristics
The discharge voltage of a sealed NiCd cell typically remains relatively constant until most of its capacity is discharged. It then drops off rather sharply. The flatness and length of the voltage plateau relative to the length of discharge are major features of sealed NiCd cells and batteries. The discharge curve, when scaled by considering the effects of all the application variables, provides a complete description of the output of a battery. Differences in design, internal construction, and conditions of actual use of cell affect the performance characteristics. For example, FIG. 7 illustrates the typical effect of discharge rate.
5.3 Charge Characteristics
Nickel-based batteries are easily charged by applying a controlled current. The charging current can be pure direct current (DC) or it may contain a significant ripple component such as half-wave or full-wave rectified current.
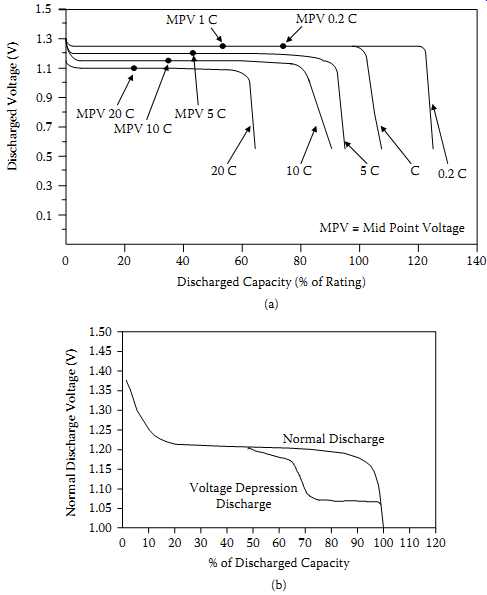
FIG. 7 Discharge curves for NiCd cells: (a) typical curves at 23ºC; (b)
voltage depression effect
This section on charging sealed nickel-cadmium batteries refers to charging rates as multiples (or fractions) of the C rate. These C rate charging currents can also be categorized in descriptive terms, such as standard-charge, quick-charge, fast-charge, or trickle charge as shown in TBL. 3. When a nickel-cadmium battery is charged, not all of the energy input is converting the active material to a usable (chargeable) form. Charge energy also goes to converting active material into an unusable form, generating gas, or is lost in parasitic side reactions.
FIG. 8 shows the charge acceptance of NiCd cells. The ideal cell, with no charge acceptance losses, would be 100% efficient. All the charge delivered to the cell could be retrieved on discharge. But nickel-cadmium cells typically accept charge at different levels of efficiency depending upon the state of charge of the cell, as shown by the bottom curve of FIG. 8.
===
TBL. 3 Definition of Rates for Charging an NiCd Cell
Charge Rate Method of Charging Multiples of C-Rate Recharge Time (Hours) Charge Control Standard; Required Trickle 0.02-0.1 Used for maintaining charge of a fully charged battery
===
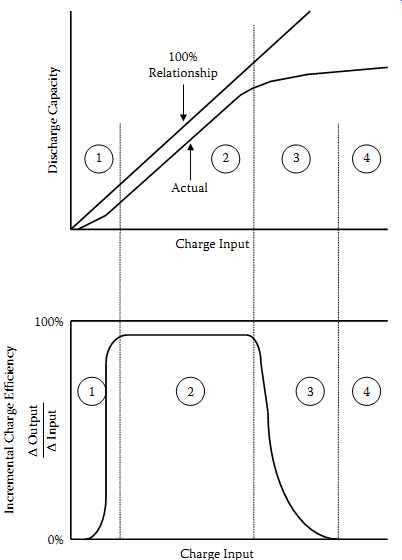
FIG. 8 Charge acceptance of a sealed NiCd cell at 0.1ºC and 23ºC.
FIG. 8 describes this performance for successive types of charging behavior (zones 1, 2, 3, and 4). Each zone reflects a distinct set of chemical mechanisms responsible for loss of charge input energy.
In zone 1, a significant portion of the charge input converts some of the active material mass into a nonusable form; that is, charged material not readily accessible during medium- or high-rate discharges, particularly in the first few cycles. In zone 2, the charging efficiency is only slightly less than 100%; small amounts of internal gassing and parasitic side reactions are all that prevent the charge from being totally efficient. Zone 3 is the transition region.
As the cell approaches full charge, the current input shifts from charging positive active material to generating oxygen gas. In the overcharge region, zone 4, all of the current coming into the cell generates gas. In this zone the charging efficiency is practically none.
The boundaries between zones 1, 2, 3, and 4 are indistinct and quite variable depending upon cell temperature, cell construction, and charge rate. The level of charge acceptance in zones 1, 2, and 3 is also influenced by cell temperature and charge rate. For details, (9) is suggested.
5.4 Voltage Depression Effect
When some NiCd batteries are subjected to numerous partial discharge cycles and overcharging, cell voltage decreases below 1.05 V/cell before 80% of the capacity is consumed.
This is called the voltage depression effect, and the resultant lower voltage may be below the minimum voltage required for proper system operation, giving the impression that the battery has worn out. See FIG. 7(b). When cells are exposed to overcharge, particularly at higher temperatures, this is quite common, and the voltage may be about 150 mV lower than the normal cell voltage. Voltage depression is an electrically reversible condition and disappears when the cell is completely discharged and charged. This process is sometimes called conditioning. This effect is sometimes erroneously called the "memory effect."
6 Nickel Metal Hydride Batteries
While NiCd battery performance was rapidly advancing after 1980, nickel metal hydride (NiMH) cells introduced in early 1990s have shown nearly a 170% increase in energy density. By 2000 volumetric energy density of NiMH cells had increased over 300 Wh/ liter (13). These extensions of the Ni-based chemistries have become popular with product applications such as notebook computers, cellular phones, and the like. The first practical NiMH batteries entered the market in the early 1990s. In these cells the environmentally unfriendly cadmium negative electrode was replaced by an alloy that could reversibly absorb and desorb hydrogen. This chemistry was the choice for electric vehicles till about 2005.
6.1 Construction
In many ways, nickel-metal hydride (NiMH) batteries are the same as NiCd types, but they use nickel for the positive electrode, and a recently developed material known as a hydrogen-absorbing alloy for the negative electrode. When an NiMH cell is charged, hydrogen generated by reaction with cell electrolyte is stored in the metal alloy (M) in the negative electrode. Meanwhile at positive electrode, which consists of nickel oxyhydroxide loaded into a nickel foam substrate, a hydrogen ion is ejected and nickel is oxidized. With an operating voltage of 1.2 V, they provide high-capacity, large-energy density characteristics comparable to those of NiCd models.
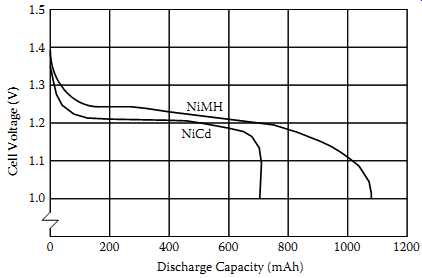
FIG. 9 Comparison of discharge characteristics of NiCd and NiMH batteries.
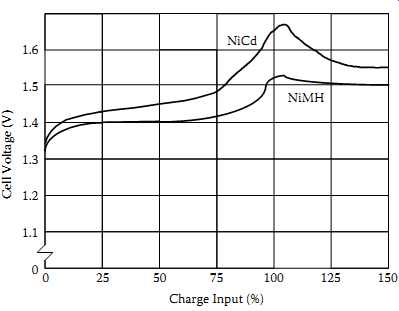
FIG. 10 Battery voltage at the achievement of 100% charge.
6.2 A Comparison between NiCd and NiMH Batteries
The NiCd cell is more tolerant of fast recharging and overcharging than NiMH cells.
NiCd cells hold their charge longer than do NiMH cells. NiCd cells will withstand between 500 and 2000 charge/discharge cycles compared to about 500-800 cycles for NiMH cells. Further, NiCd cells will withstand a wider temperature range than NiMH cells. On the other hand, NiMH cells don’t exhibit the notorious "memory effect" that NiCd cells sometimes do. As with any new technology at the time of entering the market, NiMH's prices were higher than those of NiCds.
Voltage profile of NiMH cells during discharging is very similar to that of the NiCd cells.
NiMH cells' open-circuit voltage is 1.3-1.4 V. At moderate discharge rates, NiMH cells' output voltage is 1.2 V. Both NiCd and NiMH cells have relatively constant output voltage during their useful service. FIG. 9 is a typical graph from a battery company comparing the output voltage of 700 mAh NiCd and 1100 mAh NiMH AA cells while under load. Note that the NiMH cell's greater capacity results in approximately 50% longer service life.
NiMH chemistry advances helped introduce batteries suitable for electric vehicles and aerospace applications. These bipolar NiMH batteries were meeting the volumetric and gravimetric energy density needs of these applications during the mid-1990s to mid-2005 (18, 19).
FIG. 10 is another typical battery-company graph showing that NiCd and NiMH batteries and cells charge in similar fashions as well. However, the little bumps at the end of the two cells' charge curves bear closer examination. You will always see these negative excursions even though absolute cell voltages vary significantly with temperature.
The negative excursions signal a fully charged cell more or less independently of temperature, a useful quirk that sophisticated battery chargers exploit. Note that the NiCd cell's negative-going voltage excursion after reaching full charge is more pronounced than the NiMH cell's.
7 Lithium-Based Rechargeable Batteries
Toward the latter part of the 1990s, the demand for portable systems was increasing at a dramatic rate. Meeting these goals required improvements in battery technologies beyond traditional NiCd and NiMH systems. Newer lithium-based rechargeable battery systems have overcome the safety and environmental obstacles posted by early efforts and are, in general, the most efficient rechargeable battery packs available.
With an energy density by weight about twice that of nickel-based chemistries ( TBL. 1), Li-ion batteries can deliver lighter-weight packs of acceptable capacity.
Li-Ion also has about three times the cell voltage of NiCd and NiMH batteries; therefore fewer cells are needed for a given voltage requirement. Li-ion batteries have become the choice in recent versions of notebook PCs and many other portable systems because of their high energy density, declining costs, and readily available management circuits.
Rechargeable lithium cells come in several different chemistries, namely (a) lithium-ion, (b) lithium-polymer, (c) lithium-metal, and (d) lithium-iron phosphate. Most of these chemistries came into commercial use after 1992 onwards (20-23). FIG. 11(a) indicates the progress of Li-ion chemistry based on the commonly used 18650-type cells, which is the most mature of all the lithium cells. FIG. 11(b) indicates the relative capabilities of the four common rechargeable chemistries.
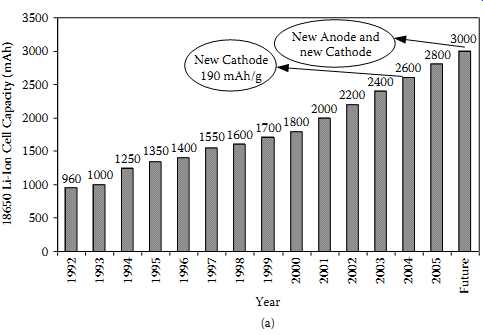
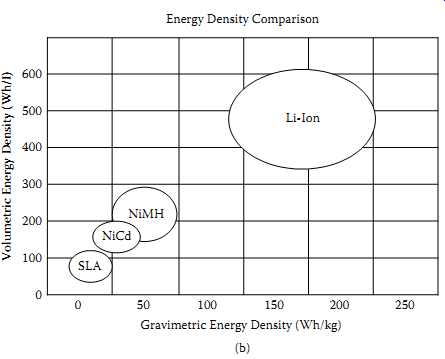
FIG. 11 Progress of the Li-ion cells and comparison with other chemistries:
(a) milliampere hour capacity increase over the period from 1992 for 18650
cells; (b) comparison of Li-ion with other chemistries. =Energy Density Comparison.
Gravimetric Energy Density (Wh/kg)
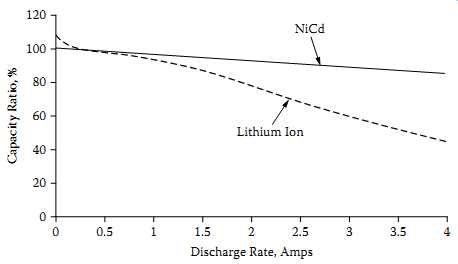
FFIG. 12 Li-Ion and NiCd capacity versus discharge current. Discharge Rate,
Amps
The first noticeable difference between Li-based chemistries and nickel-based chemistries is the higher internal impedance of the lithium-based batteries. FIG. 12 shows this by graphing the actual discharge capacity of an Li-ion cell at different discharge currents compared to an NiCd cell. At a 2A discharge rate (2 C), less than 80% of the rated capacity is available for Li-ion compared to nearly 95% of the rated capacity for NiCd.
For systems with discharge currents greater than 1 A, the capacity realized from the Li-ion battery may be less than expected. Parallel battery stack configurations are often used in Li-ion battery packs to help reduce the severity of this problem. Due to the nature of the lithium chemistries, lithium batteries cannot tolerate overcharge and overdischarge.
Given the comparison of energy densities of fuel, batteries, and explosives ( TBL. 2), the most important factor in using lithium chemistries in a portable consumer product is safety. Fortunately, battery safety is comprehensively addressed by cell and battery pack assemblers (BPAs) in concert with the semiconductor manufacturers.
Commercially available Li-ion packs have an internal protection circuit that limits the cell voltage during charge to between 4.1 and 4.3 V per cell, depending on the manufacturer. Voltages higher than this rating could permanently damage the cell. A discharge limit of between 2.0 and 3.0 V (depending on the manufacturer) is necessary to avoid reducing the cycle life of the battery and damaging the battery.
7.1 Construction
The anode, or negative electrode, in an Li-ion cell is comprised of a material capable of acting as a reversible Li-ion reservoir. This material is usually a form of carbon, such as coke, graphite, or pyrolytic carbon. The cathode, or positive electrode, is also a material that can act as a reversible lithium ion reservoir. Due to lithium ions shuttling back and forth between these two reservoirs, these batteries are sometimes called the rocking-chair cell.
Preferred cathode materials are currently LiCoO2, LiNiO2, or LiMn2O4 because of their high oxidation potentials of about 4V versus lithium metal. Commercially available Li-ion cells use a liquid electrolyte made up of mixtures that are predominantly organic carbonates containing one or more dissolved lithium salts (27). While LiCoO2 was the preferred cathode material at the early stages of development, in newer systems LiMn2O4 cathodes are used. Chemical process details are summarized in (27). In the latest generation of Li-ion cells, a new cathode material known as Nickel oxide-based New Platform (NNP) is used by Panasonic batteries (21), extending the commonly used 18650 series to 2.9 Ah.
In lithium polymer batteries, the liquid electrolyte is replaced with a polymer in gel or solid form. The polymer electrolyte provides the required electrode stack pressure, so the metal can is no longer required and it becomes possible to package the cells easily.
A laminate of aluminum foil and plastic, the pouch occupies less space and weighs less than the metal can. For these reasons lithium polymer cells came in compact prismatic cell formats around early 2000 (28). Also, they are considered safer than liquid Li-ion, as they don't leak when they are punctured. As a result simplifications are possible for in-pack protection circuits.
LiFePO4 batteries, also known as LFP battery systems, were introduced around the late 1990s, and recently they have gone into mass production, due to demand from EVs, hybrid EVs, electric bikes, and power tools. In these batteries' cathode material, LiFePO4 is environmentally benign, inexpensive, and relatively abundant.
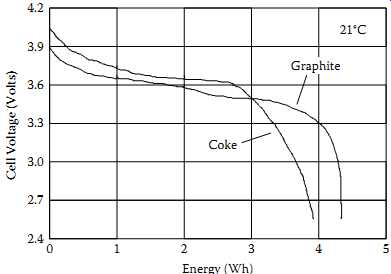
FIG. 13 Li-ion discharge profile for different electrodes.
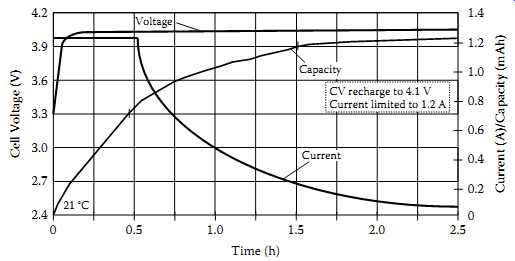
FIG. 14 Li-ion charge profile at constant potential charging at 4.1 V and
current limited to 1.2 A.
7.2 Charge and Discharge Characteristics
Today, the predominant Li-ion technologies use coke or graphite for an anode material.
FIG. 13 illustrates the differences in the two types of cells during discharge.
The graphite anode discharge voltage is relatively flat during a majority of the discharge cycle, while the coke anode discharge voltage is more sloped (28).
The energy available from the graphite anode cell is higher for a given capacity due to the higher average discharge voltage. This may be useful in systems that need the maximum watt-hour capacity for a given battery size. Also, the charge and discharge cut-off voltages between the two Li-ion systems vary among manufacturers.
FIG. 14 shows the typical charge profile for Li-ion batteries. The charge cycle begins with a constant-current limit, transitioning to a constant-voltage limit, typically specified between 4.1 V and 4.3 V ±1%, depending on manufacturer's recommendation.
This allows maximum charge capacity without cell damage. Charging to a lower voltage limit does not damage the cell, but the discharge capacity will be reduced. A 100 mV difference could change the discharge capacity by more than 7%.
8 Reusable Alkaline Batteries
Alkaline technology has been used in primary batteries for several years. With the development of the reusable alkaline manganese technology, secondary alkaline cells have quickly made their way into many consumer and industrial applications. In many applications, reusable alkaline cells can be recharged from 75 to over 500 times, and initially have three times the capacity of a fully charged NiCd battery. These cells don’t compete with NiCds in high-power applications, however.
Intensive research and development activities carried out at Battery Technologies Inc. (BTI), Canada, and at the Technical University in Graz, Austria, in the late 1980s and early 1990s resulted in the successful commercialization of the rechargeable alkaline manganese dioxide zinc (RAM) system. BTI has chosen to sell licenses and production equipment, where necessary, for the manufacturing and worldwide marketing rights of its proprietary RAM technology. For example, Rayovac Corporation, one of the licensees, launched its line of reusable alkaline products under the name RENEWAL in the United States, Pure Energy Battery Corporation in Canada (PURE ENERGY), and Young Poong Corporation in South Korea (ALCAVA).
The chemistry behind the reusable approach depends on limiting the zinc anode to prevent overdischarge of the MnO2 cathode. Additives are also incorporated to control hydrogen generation and other adverse effects on charge. Rated cycle life is around 25 cycles to 50% of initial capacity. Longer cycle life is possible depending on drain rate and depth of discharge. To take advantage of the reusable alkaline cell and increase its life, a special "smart charger" is required.
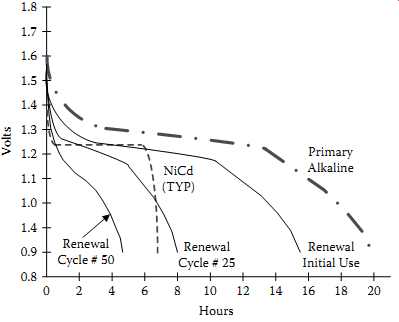
FIG. 15 100 mA discharge curve comparison for NiCd, primary alkaline, and
reusable alkaline
===
TBL. 4 Capacity of "AA" Cells at Various Depths of Discharge (DOD) (Values in mAh) 125 mA to 0.9 V Condition 100% DOD 30% DOD 10% DOD Cycle 1 1,500 450 150 Cycle 50 400 Cumulative 50 33,000 22,000 7,000 Cumulative 100 44,000 15,000 Cumulative 500 73,000
===
8.1 Cumulative Capacity
Using reusable alkaline cells can drive down the total battery cost to the consumer. This cost saving can be determined by looking at the cumulative capacity of a reusable cell versus the one-time use of a primary alkaline cell. FIG. 15 illustrates the capacity of AA cells being discharged down to 0.9 V at 100 mA. It shows that although the initial use of the reusable alkaline is almost that of primary alkaline, the reusable one can be recharged for continued use. TBL. 4 shows the increase in cumulative capacity by limiting the DOD and achieving more cycles.
Overcharging also affects the cycle life of reusable alkaline. Reusable alkaline is not tolerant of overcharge and high continuous-charge currents, and may be damaged if high current is forced into them after they have reached a partially recharged state.
Proper charging schemes should be used to prevent an overcharged condition.
===
Fast charging Cycle life Shelf life Energy Density_Wh/I Specific Energy_Wh/kg NiMH Li-Ion ReVolt Zn air
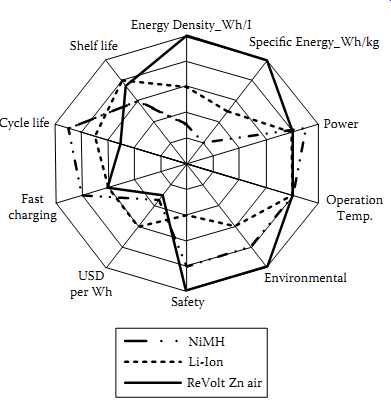
FIG. 16 Performance comparison of rechargeable Zn-air chemistry with other
chemistries.
===
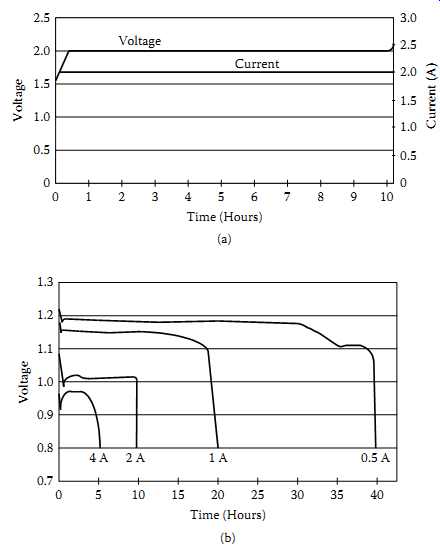
FIG. 17 Charge/discharge characteristics of a Zn-air chemistry: (a) charge;
(b) discharge.
===