AMAZON multi-meters discounts AMAZON oscilloscope discounts
... (<< Cont. from part 1)
9 Zn-Air Batteries
Primary Zn-air batteries have been in existence for over 50 years with applications such as hearing aids and harbor buoys. The light weight and high energy content in Zn-air technology has promoted research on Zn-air rechargeable chemistry by companies such as AER Energy Resources, USA, in the late 1990s, and around 2009 by companies such as RWE Innogy ( Germany) and ReVolt Technology AS (34). The focus is on electric vehicles and portable appliances. Another application is solar-powered rural telecom systems.
Rechargeable Zn-air technology is an air-breathing technology where the oxygen in ambient air is used to convert zinc into zinc oxide in a reversible process. Cells use air-breathing carbon cathode to introduce oxygen from air into potassium-hydroxide electrolyte.
Cathode is multilayered with a hydrophilic layer, and the anode is comprised of metallic zinc.
The characteristic voltage of zinc-air systems is nominally around 1 V. For example, during discharge, they will operate within a voltage between 1.2 and 0.75 V. The current and power capability of the system is proportional to the surface area of the air-breathing cathode. For more current and power, a larger-surface-area cell is required. For less current and power, a smaller cell may be used. Compared to other rechargeable chemistries, Zn-air needs an air manager for an intake and exhaust of air to allow the chemical process.
FIG. 16 compares the performance of recent developments on zinc-air chemistry with other common rechargeable chemistries. This clearly indicates that Zn-air batteries require less weight and volume. Discharge and charge characteristics of Zn-air batteries by AER Energy Resources are shown in FIG. 17.
The cells exhibit a flat voltage profile over the discharge cycle. Typical charge voltage is 2 V per cell using a constant voltage/current taper approach. Life cycle varies between 50 and 400, depending on the depth of discharge. Cost per watt-hour is apparently the lowest compared to Ni- and Li-based chemistries.
10 Battery Management
Two decades ago, battery management consisted of having a reliable, fast, and safe charging methodology to be selected for a battery bank, together with the monitoring facilities for detecting the discharged condition of the battery pack. With modern battery technologies emerging, the demands from the cost-sensitive portable product market, as well as the medium-power range products such as UPS and telecom power units, attributes of a modern battery management system may include:
• Battery modeling
• Battery-charging methods and charge control
• Determination of state of charge (SoC)/end of discharge
• Gas gauging
• Monitoring battery health issues
• Communication with the host system/or power management subsystems
• Battery safety The following sections provide some concepts and techniques related to modeling of batteries for best performance extraction, managing a given chemistry for best run time and the longest life, the safety of battery packs, and prognostics for health management of battery packs.
10.1 Modeling of a Cell to Reflect Its Electrochemistry
As engineers we tend to work with device data sheets, leaving the device design and its behavior to be decided by the device expert, and a team of electrochemists to give us a mass-producible cell. In an oversimplified circuit equivalent, we tend to simplify a battery to a voltage source (with open circuit voltage) and a series resistance. However, voltage profiles of batteries during discharge and charge don’t exactly reflect the accuracy of this simplified assumption. FIG. 18 indicates the chemical process within a battery as it discharges its stored chemical energy to a load.
As we have seen in FIG. 1, battery capacity decreases as the discharge rate increases.
Also, as per FIG. 5 we see that a cell can have high pulse discharge, if we allow resting between pulses. These kinds of behavior are simply explained by FIG. 18.
FIG. 18(a) shows the case of a fully charged cell with maximum concentration of active species. When a load is connected, the load current causes this active species to be consumed at the electrode surface, FIG. 18(b), and replenished by the diffusion process from the bulk of the electrolyte. A higher load current causes a higher concentration gradient, and thus a lower concentration of active species near the electrode surface.
When this concentration falls below a particular threshold, a voltage cutoff occurs.
However, the unused charge is not physically lost but is simply unavailable at the electrode surface due to lag between reaction and diffusion rates. Decreasing the discharge rate effectively reduces this lag as well as the concentration gradient in the vicinity of the electrode. When the recovery occurs ( FIG. 18(c)) a high current discharge is possible until the active species are nearly fully consumed as in FIG. 18(d).
This simplified discussion on the process of charge transfer, diffusion process, etc., leads to curiosity toward more complex chemical behavior of a cell, which is the subject of an electro-chemist. Such complex chemical processes inside a cell lead us to develop a more accurate circuit model suitable for modeling a battery based on simplified engineering information extracted from a data sheet. Based on recent research (37-39), NiMH or Li-ion cells can be modeled using modern finite element methods (39) for temperature behavior, while automated test systems can be used to extract information for simplified models (38) to reflect the cell behavior. For much more simplified requirements, extracting data from cell manufacturer data sheets is also a possibility (37).
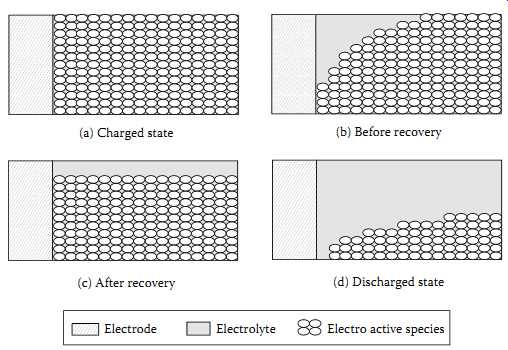
FIG. 18 Behavior of a symmetric electrochemical cell: (a) fully charged
state; (b) before recovery; (c) after recovery; (d) discharged state. (a)
Charged state (c) After recovery (d) Discharged state (b) Before recovery
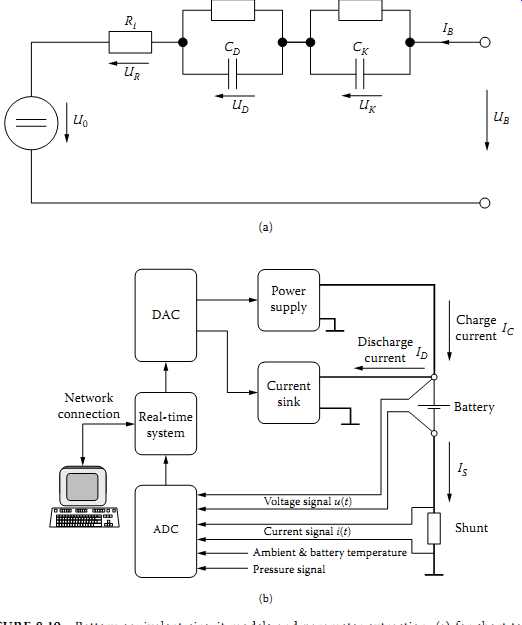
FIG. 19 Battery equivalent circuit models and parameter extraction: (a)
for short-term behavior and thermal performance; (b) test setup for extracting
parameters of model.
Charge current; Battery Shunt; Pressure signal; Real-time system Current sink Discharge current; Power supply; Network connection DAC; Current signal i(t) Voltage signal u(t) Ambient & battery temperature
10.2 Battery Equivalent Circuits
Battery equivalent circuits are useful for modeling the behavior of a battery pack, to predict its short-term behavior; its long-term performance with regard to discharge rates, temperature changes, and life cycle prediction; as well as its pulse discharge performance.
There are many different models available, ranging from a simple voltage source with internal resistance to equivalent circuits modeling the effects of charge state, temperature, pressure, aging, and many more aspects of the battery pack.
To predict the performance of a battery in the short term, simplified equivalents such as are shown in FIG. 19(a) are possible. This model is valid for time scales ranging from milliseconds up to a few seconds at a constant state of charge/discharge and temperature.
In FIG. 19(a):
• UB and IB are the terminal voltage and current.
• Uo is the open-circuit voltage.
• Ri is the constant part of the internal resistance (connector, electrodes, electrolyte).
• RD and CD are the effects on the surface of the electrode (double-layer capacitance effect).
• Rk and Ck reflect the effect of diffusion process in the electrolyte.
===
TBL. 5 Model Parameters for a Typical 9 Ah NiMH Cell
Components of Cell Internal Resistances Capacitances Ri 1 mΩ RD 0.35 mΩ CD 171 F RK 1.6 mΩ CK 16,000 F
===
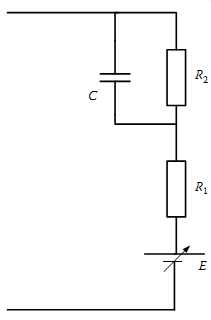
FIG. 20 A simplified equivalent circuit model for an Li-ion cell usable
for data sheet parameter extraction.
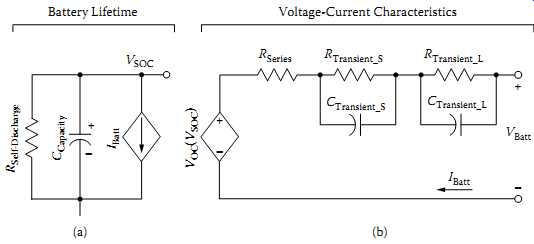
FIG. 21 A battery model suitable for Cadence simulation: (a) model suitable
for capacity, SOC, and run-time estimation; (b) model suitable for transient
response estimation. (Reproduced from Chen, M., and G. A. Rincon-Mora, IEEE
Transactions on Energy Conversion 21, 2, 2006, 504-11. With permission.)
To deal with longer prediction times or different temperature situations, the values of components have to be Adapted according the changes inside the battery.
Reference discusses the details of a test setup that can be used to extract the parameters for the equivalent circuit model shown in FIG. 19(a). FIG. 19(b) shows some details of such a test setup. TBL. 5 indicates the component values related to a 9 Ah NiMH battery with 270 A allowed current. Given the time constants for the surface effects of the electrodes, RD and CD and the time constants related to the diffusion process, RK and CK, one should be able to predict the battery behavior to match the experimental data available in data sheets.
If a more simplified model is useful, public information available on battery data sheets can be used to arrive at the model shown in FIG. 20. In this case the battery voltage curves based on different discharge rates, measured in multiples or fractional C rates, can be used using simplified graphical and calculative approaches. This three-component model is based on:
• Open-circuit voltage (equilibrium potential), E
• An internal resistance Rint having two components, R1 and R2
• An effective capacitance that characterizes the transient response of charge double layers in porous electrodes
More details related to this procedure are discussed. For design of battery packs for portable systems, an accurate prediction of battery models for run time and V-I performance Cadence simulation can be practically used. More details and various equivalent circuits suitable for this purpose are discussed, from a design engineer's viewpoint. A set of battery models suitable for Cadence-type simulation work as proposed is shown in FIG. 21. This uses two sets of parameters where FIG. 21(a) indicates a capacitor and a controlled current source inherited from run time-based models. An RC network-based model in FIG. 21(b) based on Thevenin models simulates the transient response (44).
Another important condition in a battery is the battery temperature and the ambient temperature of the battery pack. By using finite element models (FEMs), it’s possible to analyze and predict the thermal behavior of a battery pack or a cell using modern FEM software combined with thermal models of the battery.
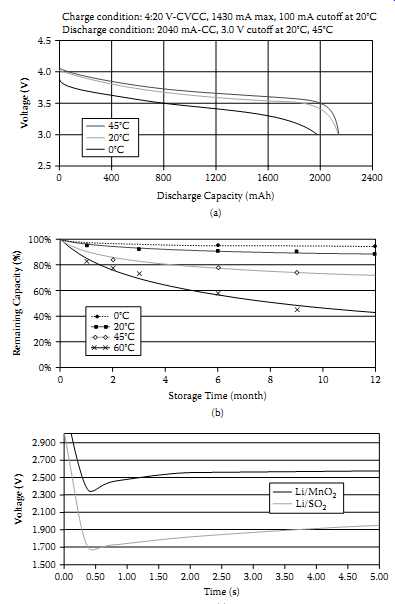
FIG. 22 Impact of temperature on lithium batteries: (a) voltage droop and
reduced capacity at lower temperatures; (b) impact of temperature on self-discharge
rate; (c) voltage delay in lithium primary chemistries at lower temperatures.
10.3 Temperature Variations and Battery Performance
In military and industrial circumstances, batteries are expected to perform well despite any wide temperature variations. However, due to intrinsic chemical reasons and packaging issues the cells perform differently at different temperatures. For example, FIG. 22(a) indicates the voltage droop and reduced capacity of Li-ion chemistry.
FIG. 22(b) indicates the impact of temperature on the self-discharge of Li-ion cells. In situations where rechargeable lithium chemistries don't allow wide temperature range, lithium primary cells could be one of the limited choices, despite their voltage delay effect at lower temperatures. FIG. 22(c) indicates this situation in two different lithium primary cell types. This situation is related to the growth of a cell's passivation layer when stored at higher temperature, and then the battery is to deliver current at a lower temperature. These situations force the battery pack designers to consider multiple temperature sensors within battery packs. If a pack will be used in high-temperature environments, several specific design principals must be applied:
• In high-temperature charge/discharge conditions, to monitor associated temperature rises a thermal sensor needs be used to disconnect at specified temperatures to avoid thermal breakdown.
• Placement of components within the pack needs be critically reviewed, particularly when using heat-generating components such as FETs.
• Packs need be designed with vent holes to dissipate the generated heat or exhaust the vented gases.
A major aim of using commercial FEM packages is to predict the dependence of SOC of a battery on temperature and the instantaneous discharge rate. In this process, a very accurate knowledge of the UB in FIG. 19(a) is necessary in addition to the estimation of the heat generation and transfer within the battery pack. To calculate temperature rise, the following heat transfer processes need to be accounted for:
• Heat conduction
• Heat transfer by convection based on boundary conditions
• Estimating the heat sources inside the cell
A detailed discussion on these aspects of the thermal problem and an FEM-based solution is available. Electrochemical-thermal modeling of Li-polymer cells is discussed.
10.4 Prognostics in Battery Health Management
Prognostics attempt to estimate the remaining component lifetime when an abnormal condition has been detected. The key to useful prognostics is not only an accurate remaining lifetime estimate but also an assessment of confidence of the uncertainty estimate. The phrase "battery health monitoring" has a wide variety of connotations, ranging from estimating the approximate voltage and other parameters to fully automated online monitoring of various measurements and estimated battery parameters.
Prognostics of battery health could be very critical in aerospace and space exploration applications. For example, a catastrophic battery failure occurred in NASA's Mars Global Surveyor, which stopped operating in November 2006. It was revealed later that when the spacecraft was commanded to go into safe mode, the radiator of the batteries was positioned toward the sun, which created a temperature issue in the battery system.
Prognostics and health management (PHM) in batteries for EVs and HEVs is a growing topic. PHM dynamic models use sophisticated reasoning schemes applied with the goal of estimating the SOC, state of health (SOH), and state of life (SOL). However, it remains a difficult task to predict the end of life for a battery pack. In estimating battery SOC, SOH, and SOL, monitoring the variation of battery impedance becomes very useful, as this parameter has a significant variation as the battery pack ages.
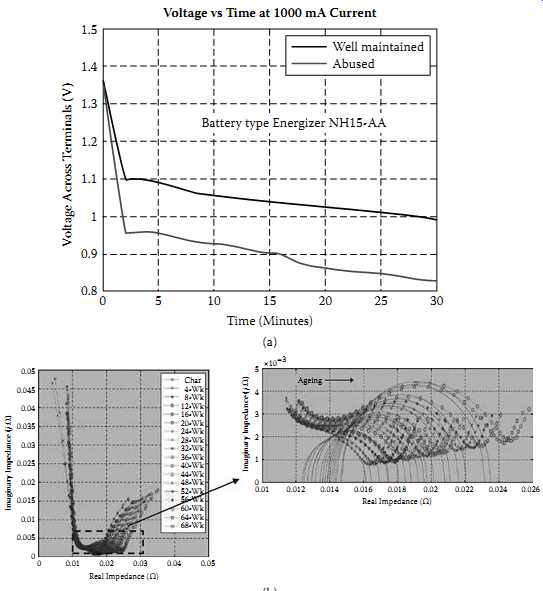
FIG. 23 Battery impedance variation with age and abuse: (a) DC impedance
comparison of a well-used NiMH cell and an abused one; (b) electrochemical
impedance spectrometry (EIS) data for a 18650-type Li-ion cell with aging;
(c) typical variation of Li-ion cells with life cycle at different frequencies.
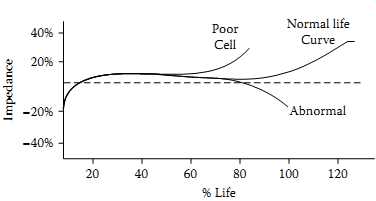
FIG. 24 VRLA battery impedance behavior over lifetime
10.5 Battery Impedance and Its Time Variation Estimation as a Prognostic Parameter
Impedance of a battery is one of the key parameters vary as the battery ages. Due to various electrochemical reasons within a cell, as the cell ages impedance keeps increasing in general. FIG. 23 indicates this situation for NiMH and Li-ion cells. FIG. 23(a) is a simple DC resistance variation for a well-used versus a badly used (overcharged repeatedly) NiMH cell. FIG. 23(b) indicates the results of measuring the impedance of a 18650-type Li-ion cell in a PHM exercise (45), and FIG. 23(c) indicates the variation of the Li-ion cell impedance versus frequency after different numbers of discharge cycles. In FIG. 23(c) it clearly shows that at lower frequencies below 10 Hz, as the discharge cycles are increased the impedance gradually increases. There are new battery management ICs that monitor this behavior in gas gauging (discussed later).
In large standby telecommunication battery banks or UPS installations, large numbers of series- and parallel-connected VRLA cells (sealed lead-acid cells) are used, and any single or multiple misbehaving cells could in the longer run create expensive replacement issues. In these cases of large and expensive battery banks, battery impedance testing is used as a prognostic technique. By automatic or manual measurement of individual cell voltages over the lifetime of the bank, test engineers can easily predict the potential failure of individual cells. In these situations, typical VRLA cells behave as per FIG. 24 in general (47). A detailed discussion on the impedance variations and terminal voltages is available.
FIG. 25 An interleaved power supply system with two batteries with battery-switching
scheme for best run time: (a) basic concept; (b) an example of implementation
with a high-rate spiral cell and a low-rate bobbin cell. (Battery A DC/DC
Converter VLSI circuit Current component Ith
(a) Discharge current Capacity Battery A Low-rate (high-capacity) cell Battery B High-rate cell Bobbin cell Spiral cell)
10.6 Energy-Aware Battery-Modeling Concepts for Best Run Time
With the availability of techniques for computationally feasible mathematical models of cells, "energy-aware system design" is another new concept currently developing to get the best out of a battery pack, with multiple cells or batteries connected to a given electronic system. Given the chemical structure and the processes inside a battery, as depicted in FIG. 18, if a battery pack can contain multiple cells, where each one of them can be connected to the load selectively depending on the best utilization model for the total energy within the pack, run time of a portable product can be improved significantly. This is particularly the case with systems based on CMOS logic where the power supply source voltage VDD and threshold voltage Vth of the FETs are the key variables for best power consumption. If these parameters can be optimized with a battery efficiency model, an interleaved power supply system (with multiple batteries selectively supplying the load conditions) can provide the best run time, given the case that a battery pack has only limited energy after an optimal charging process. This concept is shown in a simplified case in FIG. 25, with two batteries that can be selectively connected to a suitable DC-DC converter, which supplies the VLSI circuit.
In this example, where an interleaved dual battery (IDB) concept is used as in FIG. 25(b), the working principle is simple. When the discharge current is lower than a threshold value, Ith, the system uses battery A as the energy source and vice versa with battery B. Battery A is a low-rate/high-capacity cell, while battery B is a high-rate/ low-capacity cell. In this process of switching based on suitable algorithms, a suitable battery model is taken into account for optimum discharge behavior. This kind of dynamic power management of battery-powered electronics can be used for battery life optimization as well. Energy-efficient communication is another application of these concepts with electrochemical battery models.
10.7 Fast-Charging Nickel-Based Batteries
While four major battery families can accept either a standard (16-24 hr) or a fast (2-4 hr) charge, most of the discussion here is limited to fast-charging methods.
Slower-charging schemes tend to be found in simpler, price-sensitive applications, which don’t need (or cannot afford) much beyond a simple charger and a low-battery indicator.
The objective of fast-charging a battery is to cram as much energy as it takes to bring the battery back to fully charged state in the shortest possible time without damaging the battery or permanently affecting its long-term performance. Since current is proportional to charge divided by time, the charging current should be as high as the battery systems will reasonably allow.
Nickel-based chemistries prefer constant-current-type charging, while lead-acid and lithium cells prefer constant-voltage (current-limited) charging. For the constant-current cells (NiCd and NiMH), a 1 C charge rate will typically return more than 90% of the battery's useable discharge capacity within the first hour of charging. The constant potential cells (lead-acid and lithium-ion) are a bit slower to reach the 90% mark, but can generally be completely recharged within five hours. See TBL. 6 for representative and typical charging recommendations for different chemistries. The most appropriate method should be selected in consultation with the manufacturer.
Fast charging has compelling benefits but places certain demands upon the battery system. A properly performed fast charge, coordinated to the specifications of a battery rated for such charging, will deliver a long cycle life. The high charging rates involved, however, cause rapid electrochemical reactions within the cells of the battery. After the battery goes into overcharge, these reactions cause a sharp increase in internal cell pressure and temperature.
Uncontrolled high-rate overcharge quickly causes irreversible battery damage. Thus as the battery approaches full charge, the charging current must be reduced to a lower "top-off" level, or curtailed entirely.
===
TBL. 6 Representative Charging Recommendations
NiCd or NiMH Sealed Lead-Acid Li-Ion Charging current 1 C 1.5 C 1 C Voltage per cell (volts) 1.80 2.5 4.20 ± 0.05 Charging time (hours) ~3 ~3 2.5-5.0 Method for optimum fast-charge termination point See TBL. 4 Current cutoff Typically a timer
Backup charge termination method See TBL. 4 Timer
---- "Top off" rate 0.1 C 0.002 (trickle) Temperature range (ºC) 10º-40º (NiCd) 15º-30º (NiMH) 0-30º 0-40º
===
10.7.1 Charge Termination Methods
If a rapid charge is applied to a battery pack, it’s necessary to select a reliable method to terminate charging at the fully charged position. Two practical approaches for charge termination are temperature termination method and voltage termination method.
10.7.1.1 Voltage Termination Methods
Four commonly available voltage termination methods are maximum voltage (Vmax), negative delta voltage (-DV), zero slope, and inflection point (d2V/dt2). The maximum voltage method senses the increase in battery voltage as the battery approaches full charge. However, this is accurate only on a highly individualized basis. It’s necessary to know the exact value at the voltage peak, otherwise the batteries may be over- or undercharged.
Temperature compensation is also required because of the negative temperature coefficient of battery voltage. The maximum voltage will increase if the batteries are cold, causing an undercharge because the charging voltage will reach the maximum voltage trip point early. If the batteries are hot, the maximum voltage may never be reached and the batteries may be discharge. Therefore the Vmax method is generally not recommended for fast charge rates.
The negative delta voltage is the most popular of the fast-charge termination schemes.
It relies on the characteristic drop in cell voltage that occurs when a battery enters overcharge, as shown in FIG. 26. With most NiCd cells, the voltage drop is a very consistent indicator, and the -DV method is fine for charge rates up to 1 C. An inherent problem with this method is that the batteries must be driven into the overcharge region to cause the voltage decrease. Pressures and temperatures rise very rapidly at fast charge rates beyond 1 C. In cyclic applications the battery must be able to endure that continual abuse.
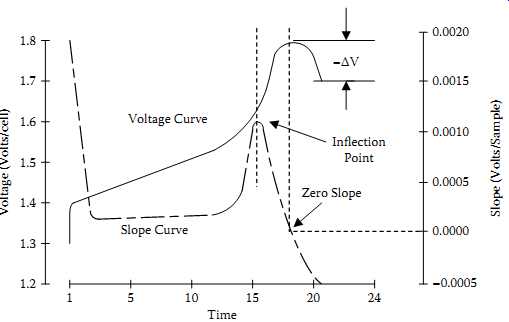
FIG. 26 Termination methods based on changes in voltage and voltage slope.
Another concern is that cells such as NiMH types don’t always have the characteristic decrease in voltage, compared to NiCds as shown in FIG. 10. This creates a problem of forward compatibility when moving from NiCd to NiMH cells. Most manufacturers of NiMH cells don’t advocate the -DV method of charge termination.
The zero-slope method monitors the point where the slope of the battery voltage reaches zero. This method is reliable for rapid charge rates up to 4 C, and is less susceptible to noise on the voltage sense lines. However, a few types of batteries such as the NiCd button cells may have a voltage slope that never quite reaches zero. Therefore the zero-slope method is better suited as a backup method.
In the inflection point (d2V/dt2) method, the system monitors the change in voltage over time and is the most sensitive indicator for preventing overcharge. The inflection point method relies on the changes in the voltage slope, shown in FIG. 26, which occurs during charge and is an excellent primary termination method for up to 4 C charge rates.
The change in the voltage slope is an extremely reliable and repeatable indication of charge. It does not rely on the decrease in voltage, which may not always occur. Instead, this method looks for the flattening of the voltage profile as the battery reaches full charge. By monitoring the relative change in the steepness of the voltage slope, this method avoids having to use absolute numbers.
10.7.1.2 Temperature Termination Method
Temperature is the main cause of failure in a rechargeable cell, so it makes sense to monitor the cell temperature to determine when to shut off charge to a battery. Three methods of charge termination, based on temperature, are common: maximum temperature cutoff (MTC), temperature difference (DT), and temperature slope (dT/dt). The maximum temperature cutoff system is the easiest and cheapest to implement, but is the least reliable.
Using a bimetallic thermal switch or a positive temperature coefficient thermistor, a simple, low-cost circuit can shut down a charging current at an appropriate temperature.
The DT method measures the difference in ambient and cell temperatures to compensate for a cool environment. It requires monitoring two temperature sensors, one for the battery temperature and one for the ambient. This method may be unsuitable if the difference between cell and ambient temperature is very large.
The DT method can become unreliable with a quickly changing ambient temperature unless an equal thermal mass is attached to the ambient sensor. This means that the DT method is suitable for a primary charge termination at lower charge rates up to C/5 if the ambient temperature is not going to change often. The DT method also provides an excellent backup charge termination scheme.
The temperature slope method (dT/dt), a more sophisticated temperature termination scheme, measures the change in temperature over time. This method uses the slope of the battery temperature, and therefore is less dependent on changes in ambient temperatures or in large differences between ambient and battery temperatures. Accurately adjusted to a particular pack, and with careful attention paid to the type and placement of the temperature sensor, the dT/dt method works very well. This dT/dt method is suitable for charge rates up to 1 C and provides an excellent backup method.
10.7.2 NiCd and NiMH Fast-Charge Methods
Nickel-based batteries such as NiCd and NiMH types are mature chemistries. Although it’s not correct to consider the NiCd and NiMH electrochemistries or charging regimens as being interchangeable, they are similar enough that they can be discussed together.
There is no one best way to fast-charge a NiCd or NiMH battery. Variables introduced by the allowable cost and size of the end application, the choice of charge termination method(s), and the specific battery vendor's recommendations will all influence the final choice of charging technique.
FIG. 27(a) shows the voltage, pressure, and temperature characteristics of an NiCd cell being charged at 1 C rate. FIG. 26(b) shows similar data for an NiMH cell.
These curves illustrate the need for a reliable termination of the high-current portion of the charge cycle, and assist in understanding the various fast-charge termination methods outlined in TBL. 7. For both electrochemistries, the ideal fast-charge termination point is at 100%-110% of returned charge. The charging current is then reduced to the top-off value for one to two hours, to bring the cell into a state of slight overcharge.
This compensates for the inefficiencies of the charging process (e.g., heat generation). If the specific application will have the battery on standby for more than several weeks, or at high temperatures, the top-off charge is followed by a continuous, low-level "trickle" charge to counter the self-discharge characteristics of NiCd and NiMH cells.
Under certain conditions, particularly following intervals of storage, an NiMH battery may give an erroneous voltage peak as charging commences. For this reason, the charger should deliberately disable any voltage-based charge termination technique for the first five minutes of the charging interval. TBL. 7 summarizes the fast-charge termination methods for NiCd and NiMH cells.
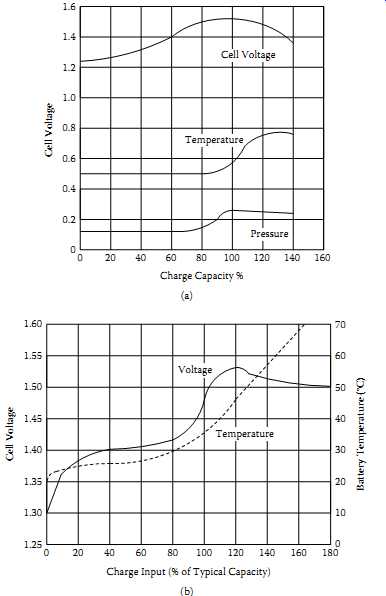
FIG. 27 Charging indications for nickel-based batteries at 1 C charge rate:
(a) cell voltage, temperature, and pressure for a typical NiCd cell at 1 C
rate charging; (b) NiMH voltage and temperature characteristics.
==
TBL. 7 Fast-Charge Termination Methods for NiCd and NiMH Batteries
Charging Technique Description Negative DV(-DV) Looks for the downward slope in cell voltage that a cell exhibits (30-50 mV for NiCd, 5-15 mV for NiMH) upon entering overcharge. Very common in NiCd applications due to its simplicity and reliability.
Zero DV Waits for the time when the voltage of the cell under charge stops rising, and is "at the top of the curve" prior to the downslope seen in overcharge. Sometimes preferred over -ΔV for NiMH, due to NiMH's relatively small downward voltage slope.
Voltage slope (dV/dt) Looks for an increasing slope in cell voltage (positive dV/ dt), which occurs somewhat before the cell reaches 100% returned charge (prior to the zero DV point).
Inflection point cutoff (d2V/dt2,IPCO) As a cell approaches full charge, the rate of its voltage rise begins to level off. This method looks for a zero or, more commonly, slightly negative value of the second derivative of cell voltage with respect to time.
Absolute temperature cutoff (TCO) Uses the cell's case temperature (which will undergo a rapid rise as the cell enters high-rate overcharge) to determine when to terminate high-rate charging. A good backup method, but too susceptible to variations in ambient temperature conditions to make a reliable primary cutoff technique.
Incremental temperature cutoff (DTCO) Uses a specified increase in the cell's case temperature, relative to the ambient temperature, to determine when to terminate high-rate charging. A popular, relatively inexpensive and reliable cutoff method.
Delta temperature/ delta time (DT/Dt) Uses the rate of increase of a cell's case temperature to determine the point at which to terminate the high-rate charge. This technique is inexpensive and reliable once the cell and its housing have been properly characterized.
==
10.8 Charging Sealed Lead-Acid Batteries
Unlike nickel based batteries, sealed lead-acid ( SLA) batteries are charged using a constant potential (CP) regimen. CP charging employs a voltage source with a deliberately imposed current limit (a current-limited voltage regulator). A significantly discharged battery undergoing CP charging will initially attempt to draw a high current from the charger. The current-limiting function of the CP regimen serves to keep the peak charging current within the battery's ratings.
Following the current-limited phase of the charging profile, an SLA battery exposed to a constant voltage will exhibit a tapering current profile as shown in FIG. 28.
When returned charge reaches 110%-115% of rated capacity, allowing a dischargeable capacity of 100% of nominal, the charge cycle is complete.
The specifics of fast-charging SLA batteries are more vendor-dependent than those of NiCd or NiMH units. The information in TBL. 8 uses data from GS Battery (USA) Inc. The primary termination method, "current cutoff," looks at the absolute value of the average charging current flowing into the battery.
When that current drops below 0.01 C, the battery is fully charged. If it will be in standby for a month or more, a trickle current of 0.002 C should be maintained. The backup termination method, according to the vendor's recommendations, should be a 180-minute time-out on the charging cycle.
To satisfy more stringent charge control recommendations, where the battery temperature, voltage, and current need to be sampled, many dedicated charge controller ICs are available on the market. The Bq2031 lead-acid fast-charge IC from Texas/ Benchmarq and UC3906 (sealed lead-acid charger) from Texas/Unitrode Integrated Circuits are examples. The UC3906 battery charger controller contains all of the necessary circuitry to optimally control the charge and hold cycle for sealed lead-acid batteries.
These integrated circuits monitor and control both the output voltage and current of the charger through three separate charge states: a high-current bulk-charge state, a controlled overcharge, and a precision float-charge or standby state. Reference (53) and Application Note U-104 (54) provide details about sealed lead-acid charge control using UC3906.
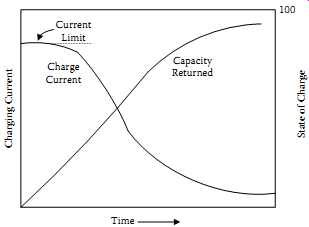
FIG. 28 Typical current and capacity-returned Vs charge time for CP charging
in sealed lead-acid batteries.
===
TBL. 8 Comparison of Recharge Requirements
Parameter SLA NiCd NiMH Li-Ion (Coke Electrode) Li-Ion (Graphite Electrode)
===
10.9 Li-Ion Chargers
Lithium-ion batteries require a constant-potential charging regimen, very similar to that used for lead-acid batteries. Because the voltage of an Li-ion cell under constant current charge could continue to rise to the point of cell destruction, absolute voltage limits are required (55). Typical recommendations for Li-ion fast-charge are indicated in TBL. 8. As with lead-acid batteries, an Li-ion cell under charge will reduce its current draw as it approaches full charge. FIG. 29 indicates this condition. However, if the charger has poor regulation on the output voltage and creates a lower output voltage, it will decrease the capacity as depicted in FIG. 29(b). The area between the graphs of current indicates the lost charge.
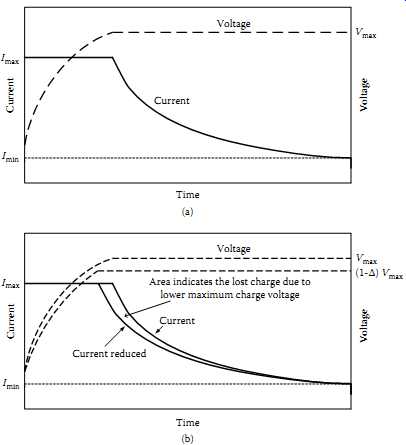
FIG. 29 Voltage-regulated charging profile for Li batteries: (a) current-limited
voltage regulated charging profile; (b) charge dependence on voltage regulation.
If the cell vendor's recommendation for charging voltage (generally 4.10 V ±50 mV at 23ºC) is followed, the cells will be able to completely recharge from any "normal" level of discharge within five hours. At the end of that time, the charging voltage should be removed. Trickle current is not recommended. If the voltage on an Li-ion cell falls below 1.0 V (or to an abnormal level), recharging of that cell should not be attempted.
If the voltage is between 1.0 V and the manufacturer's nominal minimum voltage (typically 2.5-2.7 V), it may be possible to salvage the cell by charging it with a 0.1 C current limit until the voltage across the cell reaches the nominal minimum, followed by a fast charge.
Due to special characteristics of Li-ion batteries, most Li-ion manufacturers incorporate custom protection circuits into their battery packs to monitor the voltage across each cell within the battery and to provide protection against overcharge, battery reversal, and other major faults. These circuits are not to be confused with charging circuits.
For example, the MC 33347 protection circuit is such an IC from Motorola.
10.10 Portable Chargers and Comparison of Recharge Requirements for Different Chemistries
With the availability of charge controllers, protectors, and other battery management ICs today, a designer can find many commercial ICs and supporting reference designs. Choosing the best chemistry requires a deliberative comparison between battery attributes and the required power source specifications in general. As summarized above, the four common chemistries require different recharge algorithms and give different indications when they have completed the discharge cycle. TBL. 8 provides a summary.
Most secondary batteries tolerate trickle charging for long periods. The simplest charging strategy, therefore, uses a simple linear regulator IC or a pulse-width modulator IC in conjunction with a series transistor and a currents sense resistor. Circuits such as these are available from many vendors and with a range of auxiliary features for charging single cells or nickel chemistry stacks. They sometimes use an adaptive method that adjusts the charger's behavior according to the battery's SOC. A charger of this type may start by testing the battery for deep discharge, which is determined by comparing the battery's terminal voltage with a threshold value. If the battery is deeply discharged, the charger enters a precharge mode in which it limits its current to some fraction, k, of resistor-programmed maximum charge current, IPGM.
FIG. 30 gives a representative options of charging algorithms. FIG. 30(a) is a constant-current/constant-voltage charging algorithm while FIG. 30(b) is a current foldback mode.
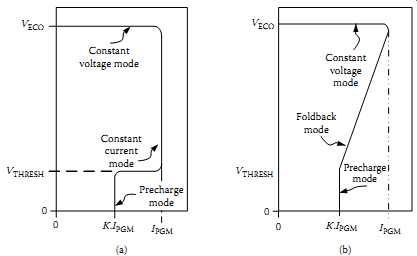
FIG. 30 Charger voltage-current algorithms: (a) constant-current/constant-voltage
case;
(b) current foldback case. Constant voltage mode Foldback mode Precharge mode
10.11 End-of-Discharge Determination
Determination of the point at which a battery has delivered all of its usefully dischargeable energy is important to the longevity of the cells that form that battery. Discharging a single cell too far will often cause irreversible physical damage inside the cell.
If multiple cells are placed in series, unavoidable imbalances in their capacities can cause the phenomenon known as "cell reversal," in which the higher-capacity cells force a backward current through the lowest-capacity cell. Knowing the end-of-discharge (EOD) point provides a "zero capacity" reference for coulometric gas gauging (discussed later).
The actual determination of the EOD point is typically done by monitoring the cell voltage. For the most accurate determination of EOD when the load is varying, correction factors for load current and the battery's state of charge should be applied, especially to SLA and Li-ion batteries. The essentially flat discharge profiles of NiCd and NiMH make these corrections a matter of user discretion for most load profiles.
TBL. 9 shows voltages commonly used to indicate the EOD point for the four battery types.
===
TBL. 9 Typical End-of-Discharge Voltages
Cell Type EODV (Volts) Comments Lead Acid 1.35-1.9 V (1.8 V typical) Dependent upon loading, state of charge, cell construction, and manufacturer NiCd 0.9 Essentially constant NiMH 0.9 Essentially constant within recommended range of discharge rates Li-Ion 2.50-2.70 Dependent upon manufacturer, loading, and state of charge
===
10.12 Gas Gauging
The "gas-gauging" "or fuel-gauging" concept discussed here does not refer to the gases that may be evolved by the battery reactions, but rather to the concept of the battery as a fuel tank powering the product. Gas gauging, therefore, involves real-time determination of a battery's state of charge, relative to the battery's nominal capacity when fully charged.
It’s possible to make an inexpensive and moderately useful state of charge measurement from a simple voltage reading, if the battery being used has a sloping voltage profile.
Hence, Li-ion batteries and, to a lesser extent, SLA batteries should be amenable to such an approach. In practice, the results are less than optimal: cell voltages are dependent upon loading, internal impedance, cell temperature, and other variables. This reduces the attractiveness of the simple voltage method of gas gauging; the fact that it’s not suitable for NiCd or NiMH batteries, due to their essentially flat voltage profile, makes it commercially untenable. A clever and effective alternative is the "coulometric" method.
Coulometric gas gauging, as its name implies, measures the actual charge ( Idt) going into and out of the battery. By integrating the difference of current in and current out, it’s possible to determine the charge status of the battery at any given time. There are of course real-world details that must be observed in the actual implementation of such a gas gauge; some of the most important of these are:
1. It’s necessary to have an accurate starting point for the integrator, corresponding to a known state of charge in the battery. This is often resolved by zeroing the integrator when the battery reaches its EODV.
2. Temperature must be compensated for. The actual capacity of lead-acid batteries increases with temperature; that of nickel-based batteries decreases as battery temperature rises.
3. Appropriate conversion factors should be applied for the particular charge regimen and discharge profile used. Under conditions of highly variable battery loading, dynamic compensation may be advisable.
10.13 Battery Health
SOC is a widely used concept to represent the remaining capacity of a battery in a charge/ discharge cycle. However, due to cycle-aging phenomenon, using SOC alone may result in large errors because the full charge capacity (FCC) may be significantly less than the design capacity (DC) that denotes the FCC of a new battery.
Considering the aging effect, SOH of a battery is defined as the FCC of a cycle-aged battery to its DC. Analytical modeling of batteries can be used to get theoretically accurate values for SOC and SOH (58). With battery health defined as a battery's actual capacity relative to its rated capacity, the health of the battery can be determined and maintained in three steps:
1. Discharge the battery to the EOD point, preferably into a known load.
2. Execute a complete charge cycle, while gas gauging the battery.
3. Compare the battery's measured capacity to its rated capacity.
This sequence will simultaneously "condition" the battery (which means to overcome the so-called "memory effect" of capacity of NiCd batteries, For example), and will indicate the capacity of the battery after conditioning. The information so obtained can be used to ascertain whether the battery is in good shape, or is approaching the end of its useful life. Online SOC estimation with monitoring system is discussed in (59).
11 Battery Communication and Related Standards
In the early 1990s power management and battery management were rarely used in portable products. More-advanced processors were introduced around the mid-1990s, with very high power consumption and relatively high load currents of tens of amperes, which placed a burden on the available rechargeable battery chemistries due to rapid increase of discharge current. To meet system run times expected by the users, innovative power management concepts had to be employed. For this reason, around the mid-1990s new industry standards were proposed to standardize the battery and power management subsystems within portable products, where concepts such as Advanced Configuration and Power Interface (ACPI) by Intel were utilized. Following were the standards proposed:
System Management Bus Specification (SMBus) Smart Battery Data Specification Smart Battery Charger Specification Smart Battery Selector Specification The above specifications form the Smart Battery Systems (SBS) Specification. This specification presents a solution for many of the issues related to batteries used in portable equipment such as laptop computer systems, cellular telephones, and video cameras.
Fundamental to the SBS system is the concept that the battery contains all of the necessary components to determine the battery's state of charge, predict time to full and time to empty, specify the charging voltage and current, and determine when the battery is fully charged to fully discharged.
The concept of a smart battery system is shown in FIG. 31(a). FIG. 31(b) indicates details. It consists of an AC-DC converter (unregulated), power switch, system power supply, smart battery charger, and smart battery selector, all of which communicate with the system host and the system elements themselves via SMBus. In this case, smart battery A powers the system while battery B is getting conditioned and/or charged.
The SMBus is a two-wire interface through which simple power-related chips can communicate with the rest of the system. It uses I2C as its backbone (60). A system using SMBus passes messages to and from devices instead of tripping individual control lines.
Removing the individual control lines reduces pin count. Accepting messages ensures future expandability. With SMBus, a device can provide manufacturer information, tell the system what its mode/part number is, save its state for a suspend event, report different types of errors, accept control parameters, and return its status. The SMBus may share the same host device and physical bus, provided that an appropriate electrical bridge is provided between the respective devices. For details, are suggested.
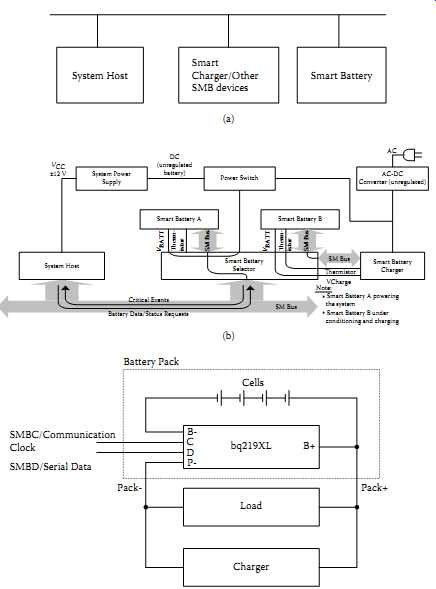
FIG. 31 Smart battery system and an SMBus module: (a) concept; (b) a typical
multiple smart battery system; (c) typical control IC (bq 219XL) and its connections.
SMBC/Communication Clock SMBD/Serial Data (System Host
System Host Smart Battery B Critical Events Battery Data/Status Requests SM Bus SM Bus SM Bus Smart Battery Charger SM Bus Smart Battery A Smart Battery Selector V Charge
Thermistor System Power Supply Power Switch AC-DC Converter (unregulated) ±12 V DC (unregulated battery) Note:
* Smart Battery A powering the system
* Smart Battery B under conditioning and charging AC
Smart Charger/Other SMB devices Smart Battery)
12 Battery Safety
With the introduction of Li-based batteries, which have high gravimetric energy density, safety of the battery powered portable products has become a concern during the last decade. In the early 2000s, some laptop fires scared the public and promoted widespread recalls of Li-ion cells. Since these events, individual companies have taken many steps to ensure that such disasters don’t recur, and the industry has joined forces to unify the standards. By 2004, IEEE had published two standards relevant to the design and manufacture of portable systems: the IEEE 1625 Standard for Rechargeable Batteries for Portable Computing, and a related IEEE 1725 Standard for Rechargeable Batteries for Cellular Phones.
The standards cover design approaches that ensure reliable operation and that minimize the occurrence of faults leading to hazards in portable computing devices and other rechargeable battery-powered systems. The standards guide the system and subsystem design through five major areas:
• Systems integration
• Cell
• Pack
• Host device
• Total system reliability
Also covered are the critical operational parameters and how they change with time and environment, the effect of extremes in temperature, and the management of component failure. FIG. 32 indicates the case of a portable computing device broken into subsystems and within the environment.
In general, portable equipment battery packs usually contain an analog front end (AFE), which is monitoring the conditions of the cells, and it usually provides a first level of protection to the pack. A battery management unit (BMU) (similar to the example in FIG. 32(c)) usually communicates with the cell stack to monitor and communicate with the host system via SMBus. Referring to FIG. 32(b), in the 1625 standard it proposes to move the second level of protection into the AFE, which communicates directly with the BMU (66). An industry-wide methodology such as design failure modes and effects analysis (DFMEA), which can be used to highlight and prioritize the possible roots of faults and hazards, is to be used with the 1625 conditions in order to get the benefits proposed in the standard. FIG. 32(c) indicates the block diagram of a battery pack compliant with the SBS 1.1 with four series Li-ion cells (66). This change in architecture helps clarify the DFMEA analysis. Compared to the older architecture, in the new architecture ( FIG. 32(b)) BMU and AFE monitor each other as well as the cell stack. Theoretically this allows the second-level protection to be integrated with the first-level protection device.
===
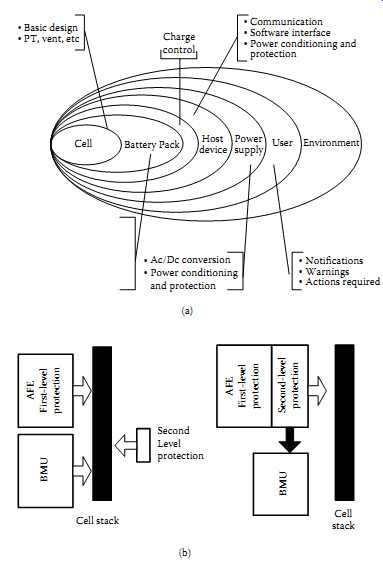
FIG. 32 A portable computing device and its environment within the case
of IEEE 1625:
(a) portable computing device broken out into subsystems; (b) proposed level of safety compared with older battery packs; (c) implementation of IEEE 1625 concepts.
Basic design PT, vent, etc Charge control Communication Software interface Power conditioning and protection Power supply User Environment Host Cell Battery Pack
Ac/Dc conversion Power conditioning and protection Notifications Warnings Actions required
AFE First-level protection BMU; BMU Second Level protection AFE First-level protection Second-level protection Cell stack Cell stack
===
As in FIG. 32(c) the new architecture consists of a BMU, an AFE integrated circuit, current sense resistor, safety FET, and a chemical fuse. BMU could be a 3.3 V microcontroller with measurement capabilities and a programmable flash. The AFE provides a high-voltage interface to the cell stack for voltage measurements, along with cell-balancing control, overcurrent protection, and a low-dropout regulator to power the BMU. Based on possible problem levels, for discrete components BMU and AFE interaction DFMEA tables can be prepared similar to the case in TBL. 10, and each item and score can be evaluated according to the following criteria:
• Severity of the fault (SEV)
• Probability of occurrence (OCC)
• Difficulty of detection (DET)
Typically, evaluation and scoring are based on experience and statistical reliability data. However, this data may not be always available, and guidance in the 1625 standard may be helpful. For more details, is suggested.
====
TBL. 10 An Example of a DFMEA Table for Discrete Components
Problem Level of the Problem Severity (SEV) Issue Probability of Occurrence (OCC) Protection Features Difficulty of Detection (DET) Risk Product Number (RPN) AFE reset output latched high Severe customer experience 4 BMU is held in reset mode.
1 As BMU no longer functions, the AFE turns off the FET(and blows fuse as an option).
1 4 AFE timeout (TOUT) output latched high Low customer experience 1 Thermistor will be always powered.
1 AFE will consume extra current, but no safety issue.
7 7 AFE TOUT output latched low Severe safety 9 Thermistor will never be powered.
1 BMU will measure out-of-range temperature and create fuse blow action. All current and voltage protection methods will be functional.
1 9 BMU sense of cell latched high Moderate safety 7 BMU voltage measurements will be 0 V.
2 First-level protection is not valid, but second-level OV protection is fully operational (as it’s an independent circuit).
====
13 Future
With the consumer electronics, EV, and the portable-product markets growing, newer battery technologies may enter the market. Major growth areas for batteries are electric vehicles and bicycles. Battery packs can challenge the designer because they are no longer a simple configuration of cells, but could contain many safety features, much intelligence, energy-aware models, selective batteries feeding the host product, serial data communication, and even recycling suggestions.
In all these situations, a simple and useful concept that can be remembered by designers is that "batteries are like human beings," and they need care and useful intelligence.