AMAZON multi-meters discounts AMAZON oscilloscope discounts
9. Uninterruptible Power Supply Commissioning and Testing
9.1 Background
It cannot be guaranteed that an electrical power supply that is free from voltage and frequency variations is going to be available during all times.
The occurrence of faults or other electrical anomalies in the users' installations or in the utility distribution system is undeniable and unpredictable. Since data centers for information technology (IT) and other high technology companies' installations are particularly sensitive to power supply fluxctuations and distortions, they typically rely on an uninterruptible power supply (UPS) for clean power and as well as for backup or standby power. Some installations even include a second UPS supplied by a separate feeder, and a standby generator that can be set to start automatically few minutes after detecting a power interruption. If the risk from weather or other local occurrences is great enough, some facilities will manually switch over to backup generation, ahead of time. FIG. 7 illustrates a typical UPS-standby generator system configuration for supplying backup power to critical installations. To assure that the UPS system will function as designed, the following tests should be performed during installation and then periodically (monthly or quarterly, depending on contractual agreements) after the system is commissioned. Tests during installation phase are divided into two stages:
1. Preinstallation (or commissioning)-test before connecting the critical loads
2. Combined-connect critical loads and test while cutting standby generator in and out
FIG. 7 System configuration diagram for a UPS-standby generator combination.
9.2 Preinstallation Checks and Tests
UPS functional and alarms tests: The purpose of this test is to check the UPS functionality, LED display, and alarm messages.
TABLE 8 Unbalanced Load Testing Sequence
UPS specification test: The purpose of this test is to check the UPS specifications to ensure that the installed equipment meets the hardware and functional requirements. Perform the test using two three-phase power analyzer instruments, such Fluke 435s, or equal. The procedure is outlined as follows: record voltage, current, real power, apparent power, power factor, voltage, and current total harmonic distortion (THD) at both the input and output. Vary the loads from 0% to 100% in 25% steps for balanced load testing. For unbalanced load testing, follow the load matrix shown in Table 8.
UPS burn-in test: The purpose of this is to verify that the UPS system can operate at the rated load under ambient room temperature conditions.
Procedure: Load the UPS to rated load and operate for 8-24 hr, depending on contractual requirements. Monitor phase currents, voltages, power, and attributes mentioned earlier including the temperature.
UPS step load and bypass loss transient tests: The purpose of this test is to demonstrate the transient response of the UPS module. During this test, the three phase voltage should remain stable and not vary much despite the changes in load current. Record data and compare against specification for deviations.
Procedure: Measure UPS transient response for:
1. 0% to 100% to 0% load steps
2. 0% to 50% to 0% load steps
3. 50% to 100% to 50% load steps
4. UPS running with loss of bypass mains UPS start and stop test: The purpose of this test is to demonstrate the correct operation when the UPS is switched on and off with full load.
Procedure: With the module running at 50% and 100% load, switch the inverter OFF and ON. Record transients, load voltage, load current, mains 2 current, and mains 1 current.
UPS full load battery discharge test: The purpose of this test is to demonstrate the correct UPS operation for the time duration of the UPS batteries (such as 15 min) at full load during a power failure.
Procedure: Measure battery cells before and after discharge using a battery monitoring system.
UPS loss and return of mains test: The purpose of this test is to demonstrate the correct operation during loss and return of the mains.
Procedure: Run module at normal load and switch the UPS main input ON and OFF. Record transients, load voltage, load current, and mains 1 current.
UPS loss and return of battery test: The purpose of this test is to demonstrate the correct operation during loss and return of UPS batteries.
Procedure: Run module at normal load and switch the UPS main battery breaker ON and OFF. Record transients, load voltage, load current, and mains 1 current.
UPS load transfer test: The purpose of this test is to demonstrate the correct operation during load transfer.
Procedure: Run module at normal load and switch UPS OFF and ON until the load is on static bypass. This procedure is reversed from static bypass to UPS. Record load voltage, load current, and bypass current.
UPS transfer to bypass and back test: The purpose of this test is to demonstrate the correct operation with external bypass.
Procedure: Transfer the load to external bypass and back to UPS. Record load voltage and load current.
9.3 Combined Test (UPS with the Generator)
Connect the critical loads and standby generator and repeat the same tests discussed above at 0% and 100% load conditions. Monitor transfer between the mains supply, UPS, and standby generator to ensure that transients and waveform distortion stays within acceptable limits.
9.4 Maintenance Test
Conduct periodic (monthly) maintenance tests throughout the life of the UPS generator power supply system. Follow the combined test procedure for every thing except the standby generator-it may not need to be tested as frequently as the other components of the UPS system including its battery system.
9.4.1 UPS Battery
System In a critical power system, knowing and understanding the condition of a stationary battery is important. Inspection and testing of the battery system should be undertaken to assess the following:
• Interconnection integrity
• State of charge
• The overall correctness of the installation
• Benchmark values for comparison to future tests
• Data to aid troubleshooting when performance is less than designed or anticipated
If basic information is not collected, analyzed, and understood before initial charging and dynamic testing, the results are unpredictable. There is a very real possibility that the battery could suffer damage if a major problem is not diagnosed in advance. Some possible consequences are:
• Terminal failure due to loose connections
• Reduced capacity due to incomplete state of charge
• Damaged cells due to incorrect polarity orientation
• High connection resistance due to incorrectly prepared mating surfaces
• Schedule delays and extra costs to replace or repair damaged items
• A correctly performed inspection, therefore, is very important for assuring battery reliability.
9.4.1.1 Battery System Inspection
The procedures, processes, and methods discussed here focus on the vented lead-acid stationary battery installed on racks. The smaller valve regulated lead-acid (VRLA) batteries normally installed in cabinets may be inspected in the similar manner. Battery system installation inspections can be performed by the installing contractor, by a third-party battery ser vice provider or by the battery manufacturer's authorized representatives.
The completed inspection report should be available to those responsible for the battery and thoroughly reviewed. Any necessary corrective action as a result of the inspection should be carried out before the battery receives its initial charge.
The inspection of the battery system is performed in three areas:
1. Mechanical inspection
2. Precharge electrical inspection
3. Electrochemical inspection prior to load testing
Mechanical inspection
These steps should be carried out prior to initial charging.
1. Check all rack hardware for tightness. This is best accomplished before racks are loaded with cells. Missing hardware should be replaced before racks are loaded. Never loosen hardware on a loaded rack because it may collapse.
2. Inspect the battery for general cleanliness. The battery should be free of spilled electrolyte, construction debris, heavy dirt, and excessive dust. Heavily soiled battery systems should be cleaned before being placed in service.
3. Inspect the rack rails and jar undersides for chemical residue. It has been observed that increasing numbers of installing contractors use various compounds to lubricate the tops of the rails. This practice makes it easier to slide jars along the rails. Unfortunately, not all compounds react benignly with jar materials. Most oil-based products-even those as mild as cooking spray-react with jar materials. In one well publicized case, a contractor used cable-pulling grease on the frame rails; within weeks, virtually all the jars were leaking. The first sign of such a reaction is the cracking and crazing of the plastic jar material. Generally, once a reaction is observed, the cell must be replaced.
To avoid this situation, installers must be familiar with the battery makers' recommendations and use only compounds approved or recommended by them. To be on the safe side, many manufacturers recommend using plain water; it provides some amount of lubrication and evaporates afterward without leaving an oily residue.
4. All jars and covers should be examined for cracks and leaks. Leaking cells should be replaced at the earliest possible time. Leaking cells quickly contaminate racks. This can cause ground fault alarms to trip and present a safety hazard to service personnel.
5. All flame arrestors should be intact and installed securely. Batteries should never be charged unless all flame arrestors are properly installed.
VRLA battery pressure relief valves should be in place and secure as well. The perimeter of the vent well and flame arrestor seal ring should be clean and dry before flame arrestors are installed. This will prevent electrolyte migration from inside the cell to outside the gasket area.
6. Check all intertier, interrack, and interaisle connecting cables for excessive stress on terminals, as evidenced by twisting and leaning of posts and terminals. Cable must not cause stress to these components. Corrective action is necessary when stress is observed.
7. A corrosion inhibiting compound is generally supplied with a battery and should be applied per manufacturer instructions. "No-Oxide A" grease is commonly used, although some manufacturers specify the use of other similar compounds. The primary function of these com pounds is to seal the critical contact area from oxygen exposure, thereby slowing the corrosion process. This can increase the time intervals between costly system interconnection reworks. Proper contact surface preparation is very important.
Precharge electrical inspection
After the mechanical inspection is complete and prior to charging the battery, the following steps should be performed:
1. Verify that all cells are arranged in the proper series connection.
A common installation error is interconnecting cells with like polarities.
2. Check all bolted interconnections for tightness to the proper value per manufacturer specifications. Errors have been observed to include (a) an incorrect torque setting and (b) a wrench graduated in foot pounds instead of the more common inch-pounds unit of measure.
3. Establish a connection resistance benchmark. This is very important.
It is recommended that a technician disassemble, clean, and remake several intercell connections at random. This will verify the effectiveness of the preparation method used by installation personnel. Average the sum of the readings of the specimen connections and use that value as the system benchmark. IEEE 484-2002, "IEEE recommended practice for installation design and installation of vented lead-acid batteries for stationary applications," recommends a 10% allowable upward deviation from the average. For example, a system whose intercell connection average value is 40 µO can tolerate a maximum of 44 µO.
TABLE 9 Gravity versus OCV
Reworking the connection usually reduces an out-of-tolerance resistance. This procedure should be conducted for intertier, interrack, and interaisle cable connections also. Only connections of the same geometry can be compared to one another.
4. After a resistance benchmark has been established, measure and record all interconnection resistances.
5. Reference the readings to the benchmark standards and make note of any connections requiring corrective action based on the acceptance criteria from item 3 above.
6. Measure and record total battery voltage at the open circuit potential.
Divide that reading by number of cells in the string. The resulting per-cell value should be close to the calculated open circuit voltage (OCV) as given in Table 9. If the tasks above have been completed and meet the acceptance criteria, initial charging of the battery may then begin. Items that do not conform to the battery manufacturer or IEEE standards must be noted on the inspection report and corrected.
Corrective action should be taken as soon as possible. The amount of time a battery requires to reach a fully charged state for testing is a function of several conditions:
- Applied charging voltage
- Ambient temperature
- Battery state of charge prior to commissioning
- Physical size of the cells
The commissioning charge, also referred to as a freshening or initial charge should be determined based on the requirements and tolerances of both battery and the equipment to which it is connected. Determine the required applied voltage by multiplying the number of cells by the per-cell charge recommendations in the battery manufacturer operating instructions. This value must not exceed the charging system capability.
Electrochemical pretesting
In pretest, the following tasks should always be completed prior to load testing the battery system:
1. Before load tests can take place, the battery must be fully charged and the state of charge must be verified. This cannot be overemphasized.
Generally, a battery is considered to be fully charged when the voltage of lowest cell in the string stops rising over three consecutive hourly readings while on equalize charge and the lowest specific gravity measurement is within the nominal rating by ±10 (0.010) specific gravity points. This can be used as a guideline during charging. Refer to the battery manufacturer's specific instructions for more detail.
2. Find the lowest cell and verify the state of charge as described above.
If the cell voltage continues to rise with the next hourly reading, continue the equalize charge until it stops rising. When that cell voltage stops rising, the battery should then be returned to normal l oat status.
Monitor cell temperature while on charge. Do not exceed the maxi mum allowable temperature or cells may be damaged.
3. IEEE 450-2002, "IEEE recommended practice for maintenance, testing, and replacement of vented lead-acid batteries for stationary applications," states a battery should receive an equalize charge and be returned to normal l oat potential for no less than 3 days, but not longer than 30 days prior to testing. This 3 day period will allow time for all the hydrogen gas bubbles (formed on the plates during equalize charging) to be released from the surface of the plates. Until all the bubbles are released, the full surface area of the plates is not available for chemical interaction with the electrolyte, and the battery could appear to have diminished capacity.
4. When items 2 and 3 are satisfied, measure and record the specific gravity of each cell in the battery just prior to the load test. If the gravity readings are within the manufacturer's recommended values, (usually ±10 points), they are considered acceptable. For specific details regarding allowable gravity values, refer to the battery manufacturer installation and operating instructions.
5. Measure and record the electrolyte temperature of every sixth cell, with not less than 10% of the total number of cells in the battery. Battery performance data is referenced to 77°F (25°C). Cooler temperatures will cause diminished battery capacity. Higher temperatures will result in increased capacity, but reduce service life. Temperature considerations are a frequently overlooked when load testing the battery system.
TABLE 10 Temperature Correction Factors for Lead-Acid Batteries
Correcting for temperature
If the cell temperature is other than 77°F, some amount of compensation should be factored into the load test procedure. Unless the purchase specification called for a different operating temperature, the UPS battery was sized by the manufacturer for operation at 77°F. Therefore, battery performance will be diminished at cooler temperatures and artificially increased at higher temperatures. The simplest way to compensate for temperature is to increase or decrease the kW setting of the load bank and then testing to see if the batteries meets the originally specified time duration before being fully discharged. Correction factors for cell temperature are listed in Table 10.
To illustrate their use, let us take a sample UPS system rated at 750 kVA and 600 kW (rated kW), and assume the cell electrolyte temperature was measured at 67°F. Table 10 shows a temperature correction factor (Tc) of 1.064.
Load bank setting (AC kW) can be expressed by the formula:
AC kW = Rated kW Tc AC kW = 600 kW 1.064 AC kW = 564 kW
The original 77°F AC kW would have been 600 kW. The corrected load bank setting indicates a difference of 36 kW (6% of rated capacity). Had the battery been tested at the full 600 kW load, the battery would have lasted less than the time specified, i.e., it would have reached its discharged state before its specified time.
9.5 Maintenance and Testing
Refer to Section 7.8 on routine maintenance and testing of switchgear batteries since there are many similarities that are common to the UPS battery systems.
The battery tests listed in Section 7.8 are applicable to the UPS batteries.
9.6 Summary
Many tests are involved when commissioning and maintaining an UPS system. Many parameters (three-phase voltage and current, power, power factor, harmonics, and transients) must be logged simultaneously over 8-24 h and documented in report format. Use a power quality analyzer with data logging and reporting capabilities, such as the Fluke 435 or an equal to make the required tests.
Also, it is critical to ensure battery system integrity before it is load tested.
It must be fully charged, properly installed and its condition verified in order to minimize the likelihood of retests and equipment damage. When com pared with the cost of downtime, delays, retests, and hardware failures, the cost of battery inspection is a bargain, well worth the expense and time added to a project. The above installation and maintenance guide is based on vented lead-acid batteries; however, many facilities may have VRLA batteries for their UPS installations. Many of the checklist items listed for the vented lead- acid batteries also apply to the VRLA batteries. It is recommended that the IEEE standards on the VRLA batteries be consulted for installation and maintenance. These standards are
1. IEEE 1187-2002, "IEEE recommended practice for installation design and installation of valve regulated lead-acid batteries for stationary applications."
2. IEEE 1189-2007, "IEEE recommended practice for maintenance, testing, and replacement of valve regulated lead-acid batteries for stationary applications."
3. IEEE 1189-2007, "IEEE guide for selection of valve regulated lead- acid batteries for stationary applications."
10. Infrared Inspection of Electrical Equipment
Infrared (IR) thermographic scanning is commonly used as a part of the electrical preventive maintenance program. IR scanning can be used easily and safely on energized electrical equipment and apparatus to diagnose electrical problems in their early stages, which then can be corrected before they become major problems. IR scanning is most useful when equipment is under heavy load because certain types of hot spots cannot be detected while the equipment is at partial load or light load. Also, many maintenance personnel conduct an IR scanning inspection before a major preventive maintenance shutdown to identify electrical problems that can be then corrected during the shutdown.
10.1 Types of Thermographic Scanners
A variety of IR thermographic systems are available for conducting IR scanning to identify heat-related problems in energized electrical equipment. The instruments range from hand-held radiometers to imaging systems or scanners. These instruments are very compact and portable. These instruments detect radiation in a narrow section of the IR band at a frequency just below the visible light given out by heat. The radiometers are noncontact IR thermometers which have temperature readouts and are usually mounted on gun-stock. These instruments are ideal for spot checking of heated electrical equipment, lines, wires, and the like. The scanners use optical components and use different detectors as noted below.
Thermal detectors
The thermal detector responds to temperature change in the detector and displays actual scene with temperature superimposed as a red graph. Coolest ambient temperature is graph baseline, and the height of trace line indicates warmer temperature. The temperature range of the thermal detector is 10°C-1000°C and it can detect temperature differences of 0.5°C. It has a slow response. The main advantage of this unit is that it requires no external cooling.
Evaporation detectors
In these detectors, a germanium lens focuses radiation from an object on thin membrane coated with gold black. The black surface is in vacuum with a few drops of oil. The oil evaporates, and condenses on the membrane forming a thermal image. It is very slow but provides quantitative judgment. There is no cooling required for this unit.
Photon detectors (argon cooled)
These types of detectors are completely self-contained and contain argon gas filled cylinders used for the detector coolant. The view is red on black, the brighter the red, the hotter the object. This detector uses six IR photo detectors, six LEDs, and a 10-segment, double-sided rotating mirror which converts the LED output into 60-line scan image. The temperature resolution is 0.1°C at 22°C between closely adjacent objects and between objects and their background.
Photon detector (nitrogen cooled)
These detectors use liquid nitrogen to cool the detector. The view is white on black, the brighter the white, the hotter the object. Also, these detectors come where the view is in color. The temperature resolution is 0.2°C. These units use camera scanner and video display. The brightness can be referenced to actual temperature.
Photon detector
These units are similar to the above units, but the image is green on black. These units do not have reference graph between brightness and temperature.
These units do not require external cooling.
10.2 Conducting an IR Thermographic Inspection
When an IR inspection is conducted, it is recommended to follow the current path, and it should be done under normal operating conditions-the heavier the loading the better an indication of the hot spots. During these surveys, it is obvious that the IR scanner detects temperature differences. A hot spot detected in an electrical equipment can be caused not only by excessive temperature due to faulty equipment (excessive resistance) but also may come about due to reflections, solar gain, normal loading, emissivity variations, and eddy current inductive heating. The person conducting IR scanning surveys should be familiar and be aware of these factors in order to identify a true hot spot. Also, additional factors such as wind, rain, snow, and strong magnetic fields can affect the IR survey results when conducting an IR scan of outdoor substations and switchyards.
After the IR survey is completed, the appraisal of the IR scan data is normally evaluated to assess whether the equipment surveyed is working properly or whether it has problem areas due to overheating. Over the years, different appraisal systems and techniques have evolved which maintenance personnel have used to determine priority of maintenance and repair actions. These are discussed next and have been summarized from a paper* presented at the National Electrical Testing Association (NETA) Annual Conference.
TABLE 11 An Example of Delta-T Temperature Criteria to Determine Priority of Maintenance Scheduling Based on Temperature Rise of Component Relative to Ambient Temperature
10.2.1 Delta-T Temperature Rating Systems
For years, IR thermographers have used delta-T temperature ratings to assess the severity of overheating electrical components. These tables are commonly broken into three or four severity categories that indicate repair priorities: the larger the temperature rise above a similar component or ambient temperature, the greater potential for failure. There are a wide variety of delta-T charts versus severity/repair urgency charts commonly used by thermographers. Table 11 shows a delta-T temperature rating chart commonly used in the electrical industry whereas Table 12 shows the delta-T criteria used by the NETA and similar criteria given in Section 21.17.5.6 of NFPA 70B, "Electrical equipment maintenance."
On the plus side, such delta-T ratings have worked quite well in the field.
They do indicate some relative degree of severity that enable repairs to be prioritized. On the negative side, there are a great number of temperature classifications and none of them are traceable to nationally recognized standards for electrical equipment. This lack of traceability has been questioned in some industries, such as in the highly regulated nuclear power industry.
The other major shortcoming of using delta-T classification systems is that they do not account for the actual load and ambient temperature upon the equipment at the time of the IR inspection. For example, an overheating cable under 70% load would be assigned the same severity rating if it was under a 10% load. Ideally, load and ambient temperature differences should be accounted for in a temperature rating system for determining accurate repair priorities.
TABLE 12 Thermographic Survey Suggested Actions Based on Temperature Rise
TABLE 13 ANSI/IEEE/NEMA Temperature Standards References
10.2.2 Standards-Based Temperature Rating System
In the United States, there are over 26 organizations that publish temperature standards for electrical equipment. However, ANSI, IEEE, and NEMA are particularly well known and referenced. The standards published by these organizations on various electrical equipment contain temperature data which consists of the standard ambient temperature, the maximum temperature rise allowed above the ambient, and the total allowed temperature, which is the sum of the ambient and the maximum temperature rise allowed.
A typical electrical equipment standard might be expressed as follows:
The key formula: Mostly all temperature standards specify the standard ambient temperature and they assume that the circuit is under 100% load.
However, electrical equipment is often run in a different ambient temperature and is rarely at 100% of rated load. So, for these standards to be meaningful, the temperatures need to be adjusted or corrected for ambient temperature and load deviations from the stated assumptions. Several of the reference standards listed in Table 13 include a formula for making these corrections. This formula using simplified symbols and terminology can be written as follows:
Ttc = (Trt - Tra)(Im/Ir)n + Tma where Ttc is the total allowable temperature, corrected for measured load and ambient temperature
Trt is the total rated temperature
Tra is the rated ambient temperature
Im is the measured current (A)
Ir is the rated current (A)
Tma is the measured ambient temperature n is the exponent, average of 1.8 (varies between 1.6 and 2.0)
Using the formula: First, we need to determine the temperature standards applicable to the equipment we are inspecting. We also need to know the maximum rated current for the equipment we are inspecting. Then, we need to measure the ambient air temperature and the actual load on the equipment.
When we enter these numbers into the formula, we end up with the total corrected temperature (Ttc). This number (Ttc) is the corrected maximum allow able temperature for this equipment and has been adjusted for the measured ambient temperature and down-rated for the measured load. The thermographer then compares his/her measured equipment temperature to this total corrected temperature. If the measured temperature is greater than the Ttc, the equipment temperature is over the specification. If it is less than the Ttc, the equipment temperature is within the specification. While this formula and procedure may look formidable, it is easily run on a simple computer. You only need to know the temperature standards, the ambient temperature, and the rated and measured loads. Of course, the thermographer needs to know how to accurately measure the temperature of the equipment so that it can be compared to the total corrected temperature (Ttc). Below is an example of using this method.
Example:
A thermographer has located an abnormally warm 100 A starter breaker.
The accompanying electrician measures a load of 30 A on the breaker. The thermographer measures an ambient air temperature of 20°C and determines that hot test part of the breaker, the terminal lug on the load side of phase C, is 31 °C. Is the equipment running within temperature specification?
SOLUTION:
The information given on the starter breaker is Rated load of breaker (Ir ) = 100 A Measured load (Im) = 30 A Measured ambient temperature (Tma) = 20°C From the temperature standards for a low-voltage circuit breaker, terminal connection to bus (or cable), the following information is obtained
Using the formula:
Ttc = (Trt - Tra) (Im/Ir) 2
+ Tma (for illustration, we use an exponent of 2)
Ttc = (95 - 40) (30/100) 2 + 20 Ttc = (55) (.3)2 + 20 Ttc = (55) (.09) + 20 Ttc = (4.95) + 20 = 24.95°C
We compare our measured temperature of 31°C to the Ttc of 24.95 and find that the heated terminal is 6.05°C above the Ttc specification which was corrected for measured ambient temperature and load.
Therefore, this example illustrates that there is a problem with this breaker and this problem will get worse as the load or the ambient temperature increases on the 100 A starter breaker.
Comparing the rating systems: Assuming that the temperatures of other two phases of this breaker were at ambient temperature, you will note that the Delta-T method of rating this potential problem would give you a tempera ture difference of 31 - 20 = 11°C. In most Delta-T classifications, this would warrant a low-to-moderate severity rating. The standards-based system and formula has determined that the equipment is over specification. In comparing the two rating systems to many similar problems, we find that that the standards-based system is almost always more conservative than the Delta-T system. In other words, the standards-based system will almost identify a problem before the Delta-T system will.
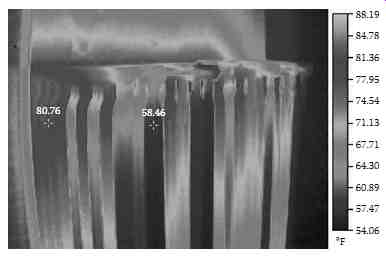
FIG. 8 Thermographic picture of a transformer radiators. (Courtesy of Black
and Associates, Inc., Sparks, MD.)
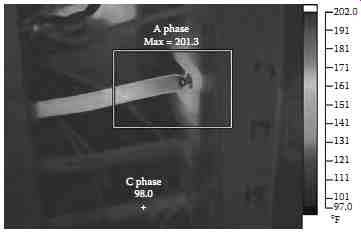
FIG. 9 Thermographic picture of a three-phase 480 V breaker lug overheating.
(Courtesy of Black and Associates, Inc., Sparks, MD.)
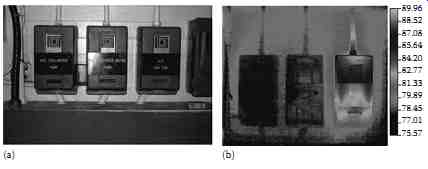
FIG. 10 Thermographic picture of an overheated motor controller. (Courtesy
of Black and Associates, Inc., Sparks, MD.)
10.3 Conducting a Thermographic Survey
The NETA (2005 NETA Maintenance Testing Specifications, Section 9) and NFPA 70B (Section 20.17) contain guidance for conducting thermographic (IR) surveys and inspection. It is a necessary requirement that the person performing the thermographic inspection be thoroughly trained and experienced in the apparatus and systems being evaluated, as well as knowledgeable of thermo graphic principles and methodology.
The following summary of the NETA and NFPA guidance on thermo graphic surveys and inspection is offered for the reader.
Visual and mechanical inspection: Inspect distribution systems with imaging equipment capable of detecting a minimum temperature difference of 1°C at 30°C. Equipment shall be capable of detecting emitted radiation and convert detected radiation to visual signals. Perform thermographic surveys under maximum loading conditions. Remove all necessary covers prior to performing IR inspection. Use appropriate caution, safety devices, and personal protective equipment when conducting the thermographic surveys.
Report: Provide a report of the thermographic survey and result including the following: description of equipment to be tested; discrepancies found; temperature difference found between the area of concern and the reference area and ambient temperature; provide probable cause of temperature difference as witnessed during the survey; identify inaccessible and/or unobservable areas and/or equipment and identify load conditions at time of inspection. Provide photographs and/or thermograms of the areas of concern with recommended actions.
10.4 Examples of Thermographic Findings
Three examples of thermographic findings are documented to familiarize the reader with the overheating problems relating to electrical equipment.
1. The first example is shown in FIG. 8 which shows transformer radiators being blocked. As can be seen in the survey photograph, the radiators showing darker color are not carrying any oil, i.e., these radiators are blocked. The temperature of radiators on the left-hand side of transformer is measured to be 80.76°F compared to the temperature of 58.46°F for the radiators in blue color. If this condition is not corrected, then over time more radiators become blocked and the transformer will overheat.
2. The second example shows an overheated three-phase 480 V breaker in FIG. 9. In this picture, phase A conductor and lug are overheated and show a temperature of 201.3°F compared to 98°F for the other two phases. Apparently the phase A lug and conductor are overheated which could be due to loose connections or high resistance built up at the lug. As discussed earlier just comparing the temperature of the three phases will be a good indication of the actual conditions. However, the Delta-T temperature, or standard-based temperature rating system could be used to provide more detail analysis of the problem.
3. The third example of three motor controllers is shown in FIG. 10a and b. In FIG. 10a, three motor controllers are shown mounted side by side and were surveyed with IR camera without removing the covers. In FIG. 10a, the left hand side controller supplies chilled water pump, the middle controller supplies condensate pump and the right hand side controller supplies auxiliary fan. It is apparent from the thermographic picture, as shown in FIG. 10b, the auxiliary fan controller has excessive heat compared to the other two controllers. Note that the excessive heat is not visible to the naked eye in the picture shown in FIG. 10a, but is very apparent in the thermographic picture shown in FIG. 10b. It is obvious that the auxiliary fan controller needs further investigation to determine the cause of excessive heating.