AMAZON multi-meters discounts AMAZON oscilloscope discounts
6.3 PQ Measurement Guidelines
PQ covers a wide range of issues, from voltage disturbances like voltage dips (sags), swells, outages and transients, to current harmonics, to performance wiring and grounding. The symptoms of poor PQ include intermittent lock ups and resets, corrupted data, premature equipment failure, overheating of components for no apparent cause, etc. The ultimate cost is in downtime, decreased productivity, and frustrated personnel. This application note gives information on how to troubleshoot PQ problems. It also gives you information on how to start fixing those problems. But before grabbing that meter, the following cautionary notes must be adhered to:
1. Suggested measurements should only be made by qualified personnel who are trained to make these measurements in a safe manner, using proper procedures and test tools rated for work on electrical power circuits.
2. To the best of the author's knowledge, recommended solutions are consistent with the NEC, but in any case, NFPA 70 (NEC), NFPA 70E, and OSHA requirements must not be violated.
3. The information provided in this guidance is believed to be accurate and current, but it’s not intended to be a substitute for the specialized knowledge and experience of professional PQ practitioners.
What this application guide offers is a starter kit, not the final word on PQ predictive maintenance.
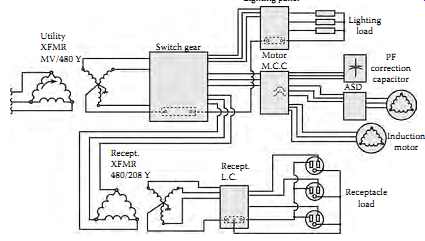
FIG. 19 Simplified electrical distribution system, typical of commercial
and industrial facilities. (Fluke Corporation)
6.3.1 Preparation for Conducting Measurements
To troubleshoot PQ problems, one approach is to start as close to the problem load as possible. The problem load is the sensitive load, typically electronic, that is somehow malfunctioning. Poor PQ is suspected, but part of your job is to isolate PQ as a cause from other possible causes (hardware, software?). Like any detective, you should start at the scene of the crime. This bottom-up approach can take you a long way. It relies on making use of a sharp eye and on taking some basic measurements. An alternative is to start at the service entrance, using a three-phase monitor, and work back to the problem load. This is most useful if the problems originate with the utility. Yet survey after survey has concluded that the great majority of PQ problems originate in the facility. In fact, as a general rule, PQ is best at the service entrance (connection to utility) and deteriorates as you move downstream through the distribution system. That is because the facility's own loads are causing the problems. Another illuminating fact is that 75% of PQ problems are related to wiring and grounding problems! For this reason, many PQ authorities recommend that a logical trouble shooting flow is to first diagnose the electrical infrastructure of the facility, then monitor if necessary.
The bottom-up troubleshooting procedure is designed to help you do this detective work.
1. Make a map: Obtain or create a current one-line diagram of the power distribution system. It’s tough to diagnose PQ problems without having a working knowledge of the site being investigated. You can start by locating or reconstructing a "as built" one-line (or three-line) diagram of the distribution system (see FIG. 19). The one-line will identify the AC power sources and the loads they serve. If you work on-site, the map might already exist in your head, but it will be a big help to everyone, including yourself, if it’s on paper. If you are coming to a work site for the first time, getting an up-to-date one line means identifying new loads or other recent changes in the system. Why go to this effort? Systems are dynamic; they change over time, often in unplanned and haphazard ways. Furthermore, while some problems are local in origin and effect, there are many problems that result from interactions between one part of the system and another. Your job is to understand these system interact ions. The more complete your documentation, the better off you will be. It’s true, however, that the sites that need the most help are the ones least likely to have a good record of what is going on in their system. So the simple rule is, at this point in the investigation, do the best you can to get good documentation, but don’t count on it being available.
2. Do a walk around of the site. Sometimes a visual inspection will offer immediate clues:
• A transformer that is much too hot
• Wiring or connections discolored from heat
• Receptacles with extension strips daisy-chained to extension strips
• Signal wiring running in the same trays as power cables
• Extra N-G bonds in subpanels
• Grounding conductors connected to pipes that end in midair. At a minimum, you will get a sense of how the facility is wired and what the typical loads are
3. Interview affected personnel and keep an incident log. Interview the people operating the affected equipment. You will get a description of the problem and often turn up unexpected clues. It’s also good practice to keep a record of when problems happen and what the symptoms are. This is most important for problems that are intermittent. The goal is to find some pattern that helps correlate the occurrence of the problem in the problem load to a simultaneous event elsewhere. Logically, this trouble-logging is the responsibility of the operator closest to the affected equipment.
4. The typical electrical distribution system for a commercial building or a light industrial facility is shown in FIG. 19 that can be divided in to two parts: (1) distribution system and (2) three-phase loads. We will start the predictive maintenance from the bottom-up, i.e., starting at the branch circuit and moving up to the service panel, transformer, and then going into three-phase loads as listed below.
Distribution system Receptacle branch circuit Service panels Transformers Electrical noise and transients Lightning protection Three-phase loads Polyphase induction motors AC ASD Commercial lighting
6.3.2 Basic Power Measurements
The basic power measurements for assessing PQ problems are phase voltages, neutral-to-ground voltage, phase currents, voltage and current distortion, voltage unbalance or imbalance, etc. The basic power measurements for PQ are listed in TBL. 6.
====
TBL. 6
Basic Power Measurements for Three-Phase Wye Equipment Voltage measurements Phase-to-neutral voltages N-G voltages Voltage sags Phase to neutral sag count Voltage harmonics Phase voltage THD Current measurements Phase currents Voltage unbalance Negative sequence, zero sequence
====
Good voltage level and stability are fundamental requirements for reliable equipment operation. The following power conditions are indicative of PQ problems and should be checked.
Voltage: Running loads at overly high or low voltages causes reliability problems and failures. Verify that line voltage is within 10% of the name plate's rating. As connections in the power system deteriorate, the rising impedance will cause drops in voltage. Added loads, especially those with high inrush, will also cause voltage decline over time. The loads farthest from the service entrance or transformer will show the lowest voltage.
Neutral-to-ground voltage shows how heavily the power system is loaded and helps quantify the triplen harmonic currents. Neutral-to-ground voltage higher than 3% should trigger further investigation.
Voltage sag count: Taking a single voltage reading tells only part of the story.
How is the voltage changing during an hour and during a day? Sags, swells, and transients are short-term variations in voltage. The voltage sag (or dip) is the most common and troublesome variety. Sags indicate that a system is having trouble responding to load requirements and significant sags can interrupt production. Voltage sags can cause spurious resets on electronic equipment such as computers or controllers, and sag on one phase can cause the other two to over compensate, potentially tripping the circuit. Sags have several dimensions: depth, duration, and time of day. Utilities use a special index to track the number of sags that occur over a period of time. To gauge the depth of the sags, they count how often voltage drops below various thresholds. The longer and larger the voltage variations more likely the equipment is susceptible to malfunction.
For example, the Information Technology Industry Council (ITIC) curve specifies 120 V computer equipment should be able to run as long as voltage does not drop below 96 V for more than 10 s or below 84 V for more than 0.5 s.
Current: Current measurements that trend upward are a key indicator of a problem or degradation in the load. While equipment is running, monitor phase, neutral and ground current over time. Make sure none of the currents are increasing significantly, verify that they are less than the nameplate rating, and keep an eye out for high neutral current, which can indicate harmonics and unbalance.
Voltage unbalance: In a three-phase system, significant differences in phase voltage indicate a problem with the system or a defect in a load. High voltage unbalance causes three-phase loads to draw excessive current and causes motors to deliver lower torque. Also, it causes motor overheating, For example, 3% unbalance in voltage causes a temperature rise of 25°C. The negative sequence voltage (Vneg) and zero sequence voltage (Vzero) are an indication of voltage asymmetry between phases. It’s desirable to keep Vneg to be less than 2%. The negative sequence voltage and zero sequence voltage are also referred to as V2 and V0, respectively.
Voltage HD: HD is a normal consequence of a power system supplying electronic loads such as computers, business machines, electronic lighting bal lasts, and control systems. Adding or removing loads from the system changes the amount of distortion, so it’s a good idea to regularly check harmonics. Harmonics cause heating and reduced life in motor windings and transformers, excessive neutral current, increased susceptibility to voltage sags, and reduced transformer efficiency. As current harmonics interact with impedance, they are converted into voltage harmonics. THD is a sum of the contributions of all harmonics. By tracking voltage THD over time one can determine if distortion is changing. The voltage harmonic distortion (voltage THD) in accordance with IEEE 519 should be less than 5%.
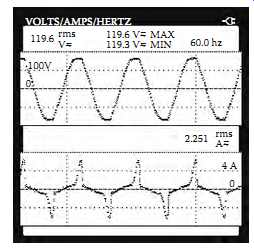
FIG. 20 Flat-topped voltage waveform measured at a receptacle. (Fluke
Corporation)
6.3.3 Measurements at the Receptacle of a Branch Circuit
Many PQ problems show up at the branch circuit level. There is a simple reason for this: that is where most of the sensitive loads are located. It’s also the end of the line of the electrical distribution system, and the place where shortcomings cannot be hidden. Let us assume you have been called in to solve the problem. You have already talked to the people involved have a rough idea of the symptoms (equipment lockups, intermittent resets or crashes, etc.) and as much sense of the timing and history of the problems as you can get. So it’s time to gather hard evidence: it’s time to take measurements. Our primary focus with troubleshooting at the receptacle level is to determine if the L-N voltage available is of sufficient stability and amplitude to supply the needs of the load(s). Make the following measurements.
Waveform: The waveform gives us quick snapshot information. An ideal waveform would be a sine wave. In this case, ( FIG. 20) the voltage wave form is flat-topped, which is typical of a building with many nonlinear loads such as computers and other office equipment. Our other measurements will tell us whether this flat-topping is excessive.
Peak voltage: The peak value is critical to electronic loads because the electronic power supply charges its internal capacitors to the peak value of the line voltage. If the peak is too low, it affects the ability of the caps to charge fully and the ability of the power supply to ride through momentary dips in the line voltage. For an rms voltage of 120 V, the peak value for a sine wave should be 169.7 V (1.414 × 120 V). However, as we see from FIG. 20, the flat-topped waveform will have a lower peak value.
The flat-topped waveform is typical of the voltage in facilities with computer loads. What causes flat-topping? The utility supplies AC power, but electronic equipment runs on DC power. The conversion of AC into DC is done by the power supply (SMPS) of the computer. The SMPS has a diode bridge which turns AC into pulsating DC, which then charges a capacitor.
As the load draws the capacitor down, the capacitor recharges. However, the capacitor only takes power from the peak of the wave to replenish itself, since that is the only time the supplied voltage is higher than its own voltage.
The capacitor ends up drawing current in pulses at each half-cycle peak of the supplied AC voltage. This is happening with virtually all the electronic loads on the circuit. If the AC power source were perfectly stiff, meaning that it had an infinite capacity to supply all the current that was required, then there would be no such thing as flat-topping (or sags or any voltage distortion). There are practical limits to what the AC power source can supply. This limit is usually described by a concept called source impedance, which is the total impedance from the point where the load is located back to the source. There are two major contributors to this source impedance. One is the wiring; the longer the conductor and the smaller the diameter (higher gauge), the higher the impedance. The other factor is the internal impedance of the power supply transformer (or other source equipment). This internal impedance is simply a way of saying that a transformer of a given size/rating can only supply so much current. The source impedance is naturally greatest at the end of a branch circuit, the farthest point from the source. That is the same place where all those electronic loads are demanding current at the peak of the wave. The result is that the voltage peak tends to get dragged down-in other words, flat-topped. The more loads there are, the greater the flat-topping. Also, the higher the source impedance, the greater the flat-topping of the voltage wave form is going to be incurred.
Rms voltage: Nominal line voltage is measured in rms which corresponds to the effective heating value. Equipment is rated in rms, not peak, because their main limitation has to do with heat dissipation. rms voltage can be too high or too low, but it’s usually the low voltage that causes problems. Low rms voltage combined with flat-topping (low peak) is a deadly combination for sensitive loads. Voltage drop is a function of both the loading of the circuit and the source impedance, which in effect means the length and diameter (gauge) of the wire run. The NEC (210-19.a, FPN No. 4) recommends a limit of a 3% voltage drop from the branch circuit breaker to the farthest outlet, and a total voltage drop of less than 5% including the feeder and branch circuit.
Recording (short-term): The limitation of the above measurement is that it’s static. Many loads require more current (inrush current) when they are first turned on. This momentary high current may cause a momentary low voltage (sag) because of the additional IR drop through the conductors. Such sags are often caused by loads drawing inrush currents on the same branch circuit, or on the same panelboard. You can measure a worst case sag of 100 ms or more (about six cycles at 60 Hz) by using a rms digital multimeter, while energizing the load. What if you want to know if there are recurring sags? The recurring sags can be recorded by using a PQ analyzer which will continuously capture sags of as little as single cycle duration (17 ms). A 1 h recording time may be enough to indicate if there are recurring sags and swells.
Recording (long-term): For longer term recording an instrument, such as Fluke's VR1710 voltage event recorder, can be used to record sags, swells, outages, transients, and frequency deviations while plugged into the outlet.
The device can be left on-site, unattended, for days and weeks, all the time catching intermittent events. The correlation of equipment malfunction with voltage events is hard evidence of a PQ problem.
N-G voltage: Let us say a simple L-N measurement at the outlet has a low reading. The low reading does not tell if the reading is low because the feeder voltage is low (at the subpanel), or if the branch circuit is overloaded. You could try to measure the voltage at the panel, but it’s not always easy to tell which panel feeds the outlet you are measuring and it’s also sometimes inconvenient to access a panel. N-G voltage is often an easier way of assuring the loading on a circuit. As the current travels through the circuit, there is a certain amount of voltage drop in the hot conductor and in the neutral conductor. The drop on the hot and neutral conductors will be the same if they are the same gauge and length. The total voltage drop on both conductors is subtracted from the source voltage and is that much less voltage available to the load.
The bigger the load, the higher the current, and the greater the N-G voltage drop. Think of N-G voltage as the mirror of L-N voltage: if L-N voltage is low, that will show up as a higher N-G voltage. N-G voltage exists because of the voltage drop due to the current traveling through the neutral back to the N-G bond. If the system is correctly wired, there should be no N-G bond except at the source transformer (at what the NEC calls the source of the separately derived system (SDS), which is usually a transformer). Under this situation, the ground conductor should have virtually no current and therefore no voltage drop on it. In effect, the ground wire is available as a long test lead back to the N-G bond.
Shared neutrals: The three-phase circuits are usually wired so that they share a single neutral. The original idea was to duplicate on the branch circuit level the four wire (three phases and a neutral) wiring of panelboards. Theoretically, only unbalanced current should return on the neutral. If the loads supplied from the three-phase circuits are balanced, which is usually the case for linear loads then there should be minimum current returning on the neutral.
However, this is not the case with nonlinear (electronic) loads, therefore the single neutral carries a much higher current. This old conventional method of wiring has become a problem with the growth of single-phase nonlinear loads. The problem is that zero sequence current from nonlinear loads, primarily third harmonic, will add up arithmetically and return on the neutral.
In addition to being a potential safety problem because of overheating of an undersized neutral, the extra neutral current creates a higher N-G voltage.
Remember that this N-G voltage subtracts from the L-N voltage available to the load. The measurement of N-G voltage of a shared neutral is shown in FIG. 21.
The following guide is offered on the N-G measurements for assessing and resolving PQ problems.
1. A rule-of-thumb used by the industry is that N-G voltage of 2 V or less at the receptacle is okay, while a few volts or more indicates overloading; 5 V is seen as the upper limit. There is obviously some room for judgment in this measurement.
2. A high reading could indicate a shared branch neutral, i.e., a neutral shared between more than one branch circuit. This shared neutral simply increases the opportunities for overloading as well as for one circuit to affect another.
3. A certain amount of N-G voltage is normal in a loaded circuit.
If the reading is stable at close to 0 V, suspect an illegal N-G bond in the receptacle (often due to loose strands of the neutral touching some ground point) or at the subpanel. Any N-G bonds other than those at the transformer source (and/or main panel) should be removed to prevent return currents flowing through the ground conductors.
4. If N-G voltage is low at the receptacle, you are in good shape. If it’s high, then you still have to determine if the problem is mainly at the branch circuit level, or mainly at the panel level. Remember, assuming there is no illegal N-G bond in intervening panels or receptacles, your ground test lead goes all the way back to the source, so you are reading voltage drops all the way to the source.
Summary: The PQ measurements on receptacle of branch circuits as discussed above are summarized in the TBL. 7. The quality of power depends on quality wiring which is referred to in the industry as performance wiring. The basic intent of performance wiring is to maintain or restore correct L-N voltage to the load. There is a distinction between performance wiring and code minimum wiring. The NEC sets the absolute minimum requirements for a wiring and is primarily concerned with fire prevention and personnel safety. The NEC should, of course, never be violated, but it’s also important to understand that the Code's objective is not to establish standards to achieve PQ. However, many facilities are finding that it pays to take the extra step and install or even retrofit facilities with performance wiring for correct operation of nonlinear loads. The attributes of performance wiring are listed in TBL. 8. There are also situations where receptacle-installed power conditioning devices are a good solution, either as a complement to the wiring changes or as an economically viable alternative to some wiring changes. By monitoring voltage events at the receptacle, any anomalies in the voltage (phase-neutral and N-G) can be detected. Predictive maintenance of PQ will ensure that that the sensitive loads are receiving the correct voltage.
FIG. 21 Measurement of N-G voltage of a shared neutral. (Fluke Corporation)
====
TBL. 7
PQ Measurements on Receptacle of Branch Circuits Voltage Measurement Look for Instrument
1. Waveform Snapshot of severity of voltage distortion Three-phase or single-phase analyzer
2. Peak voltage Excessive flat-topping Three-phase or single-phase analyzer, rms digital multimeter (peak min max)
3. Rms voltage Low rms (steady state low rms or intermittent/ cyclical sags) Three-phase or single-phase analyzer, rms digital multimeter (peak min max)
4. Recording (short-term) Sags, swells, interruptions while troubleshooter remains on-site (4 min to 1 h typical recording time) Three-phase or single-phase analyzer (sags/swells or transients)
5. Recording (long-term) Up to 4000 sags, swells, outages, transients Three- or single-phase recorder
6. N-G N-G voltage too high (or close to zero) Three-phase or single-phase analyzer, rms digital multimeter (peak min max)
====
TBL. 8
Suggestions for Performance Wiring of Branch Circuits Recommendation Reason Check for loose connections It’s easy to overlook the obvious Eliminate shared neutrals. In new installations, pull individual neutrals for each branch circuit Minimize load interaction and source impedance Limit the number of receptacles per branch circuit to three Minimize loading and load interaction Limit length of 120 V branch circuits to 50 ft (15 m) Minimize source impedance Install dedicated branch circuits for all laser printers and copy machines. Dedicated circuits should be run in their own conduit Keep victim loads and culprit loads separated. Conduit prevents coupling between circuits Install a green wire ground (do not just depend on the conduit connection) Maintain a continuous, low impedance ground Label all panels, circuit breakers, and receptacles This would not improve PQ, but it will sure make life easier for the troubleshooter and the installer
====
TBL. 9
Comparison of Average-Responding and True-rms Multimeters
Multimeter Reading Waveform Description Average-Sensing DMM True-rms DMM Sine wave Correct, Correct Square wave (l at-top voltage) 10% high Correct Current to single-phase diode rectifier 40% low Correct Current to three-phase diode rectifier 5%-30% low Correct
===
6.3.4 Measurement at the Service Panel
In the bottom-up approach, the next step is to inspect and monitor PQ attributes at the service panel. While inspecting, checkout for the following:
Visual inspection
• Feeder conductor current test
• Neutral conductor current test (feeder and branch)
• Phase-to-neutral voltage test (feeder and branch)
• N-G voltage test (feeder)
• Circuit breaker voltage drop and current on branch phase conductors
• The service panel is where the effects of single-phase harmonic loads are easy to measure. A true-rms meter ensures accurate readings of nonlinear volt ages and currents. Refer to TBL. 9 for comparison of average reading and true-rms reading multimeters.
Visual inspection:
Look for an illegal N-G bond in subpanels (see FIG. 22). This is a violation of the NEC as well as of PQ wiring. It’s also extremely common. If an illegal N-G bond is found in one panel at a site, it’s likely to be in any number of them. Who knows why they are there: perhaps the installer was thinking that all panels are wired like residential service panels; or that the quickest way to reduce N-G volt age was to install a jumper, or that the more grounds the better. In any case, remove all illegal N-G bonds-no exceptions.
Look for signs of overheating, such as discolored connecting lugs.
• Loose connections and excessive loading show up as heat. High levels of harmonic current that were not accounted for in the original wire sizing can also cause overheating. Infrared sensors are the preferred method for noncontact temperature measurement.
Of particular concern is the size of the feeder neutral conductor.
• It has long been understood that any fundamental current resulting from the unbalance of single-phase loads among the three phases will return on the neutral, but a relatively recent phenomenon is the third harmonic (triplen) currents generated by nonlinear single phase loads that all return on the neutral. The NEC-1996, the first time stated that "On a four-wire, three-phase wye circuit where the major portion of the load consists of nonlinear loads, there are harmonic currents present in the neutral conductor, and the neutral shall be considered to be a current-carrying conductor." (Article 310, "Notes to ampacity tables of 0 to 2000 Volts," Note 10.c). In effect, this requires that the neutral conductor should be at least equal to the size of the phase conductor. Many experts now recommend that the neutral be double the size of the phase conductor.
Check for shared branch neutrals. Count neutral conductors for branch circuits: if there are fewer than the phase conductors, there are shared neutrals.
Check tightness of conduit connections, especially if the conduit is being used exclusively as the grounding conductor (not recommended).
Measurements The measurements that are to be made at the service panel are summarized in TBL. 10.
====
TBL. 10
Service Panel Measurements
Measurement Look for Instruments
1. Feeder phase current Overloading and balance Three-phase analyzer; true-rms clamp meter
2. Feeder neutral current High currents from unbalanced fundamental and third harmonics Three-phase analyzer; rms DMM to find dominant frequency
3. Feeder N-G voltage High voltage indicates excessive current, near-zero indicates possible subpanel N-G bond Same
4. Branch L-N voltage Low voltage Same
5. Branch neutral current Shared neutrals Same
6. Voltage drop across breaker contacts. Hot breakers Worn contacts. Breakers in need of replacement Same
====
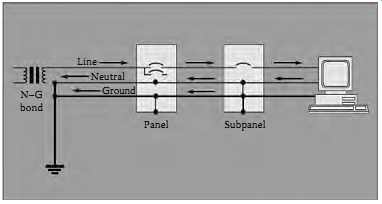
FIG. 22 Subpanel N-G bonds cause load return currents to flow on ground
conductors. This causes corrosion of pipes in grounding system as well
as noisy grounds. (Fluke Corp.)
Feeder phase current: Check each phase to make sure it’s not overloaded.
Also check for excessive unbalance.
Feeder neutral current: Measure the feeder neutral conductor for cumulative neutral current. Third harmonic currents from all three phases will add arithmetically in the neutral.
Feeder N-G voltage test: Measure the neutral-to-ground voltage, excessive N-G voltage indicates overloading. A N-G voltage at or very near zero indicates the existence of an illegal N-G bond in a subpanel.
Phase-to-neutral voltage test: Phase-to-neutral voltages are measured and recorded. They can be compared with receptacle L-N voltages to measure voltage drop.
Branch neutral current: Measure each branch neutral for overloading. The neutrals are measured instead of the phase conductors because they might share the return current of several phase conductors, yet they are not protected by breakers.
Circuit breaker voltage drop: The voltage drop across a set of breaker contacts will give you a quick measure of the wear of those contacts. Ideally, the voltage drop should be zero. In practice, there will be some voltage drop in the millivolt range, with the exact value being dependent on the load current.
As a general rule, the voltage drop should not exceed 20-100 mV, depending on load. This test can also be performed as contact resistance measurement test. For more details refer to Section 8.
Summary: The recommendations for improving PQ at the service panel are summarized in TBL. 11.
=======
TBL. 11
Service Panel Recommendations for Improving PQ
Recommendation Reason Limit length of 208 V feeder runs to 120 V subpanels to 200 ft (65 m) Minimize source impedance and chance of voltage sags Don’t cascade (daisy chain) subpanels off of other subpanels if possible, and especially if the upstream panel is heavily loaded or has loads with high inrush currents Upstream loads can cause voltage sags that will affect all downstream loads Install a green wire ground conductor (do not rely on conduit connections) Maintain a continuous, low impedance ground Minimize heat, voltage sags Reduce the load on the panel if necessary Reduce neutral return current (of the fundamental current) Redistribute branch circuit loads to improve balance of the three phases Upsize the feeder neutral if necessary, to accommodate the third harmonic. This can be done by running another neutral in parallel.
Prevent overloading and heating of feeder neutral. Will reduce N-G voltage Install third harmonic filter Reduce neutral current Nonlinear load panel Manufacturer designed for nonlinear loads
=========
In addition, the following should be considered to reduce the effects of harmonics if PQ problems are encountered at the service panel:
1. Double the neutral, going beyond the NEC requirements.
2. Use nonlinear load panels.
3. Install zero sequence filters. Such a filter effectively sinks the third harmonic, preventing overloading on the feeder neutral and the transformer.
4. Install zigzag transformers.
5. Replace older motor drives with newer, harmonics compensated ones.
6. Coping with harmonics involves larger neutrals and other methods of better being able to handle the harmonics that are present. Curing harmonics involves eliminating or reducing harmonics at their source.
7. In some cases, you can try to reduce the spread of harmonics in the system-- for example, by putting certain loads on their own trans former and panel.
8. Many harmonics problems exist because of the way things are wired.
Major rewiring is usually expensive in terms of downtime and so it’s not normally the first method used to flight a harmonics problem.
9. Look carefully at the system before implementing any curing or coping method, so you don’t wind up trying one after another until you finally have to concede you should have rewired to begin with.
The trial and error approach to fixing harmonics-related problems will usually delay an effective remedy, while dramatically raising the total cost of solving the problem.
10. With the right testing on the particular wiring, you can isolate the problem and proceed with reasonable certainty as to whether a wiring change is required or not.
11. To correct phase unbalance:
Redistribute loads to different phases to balance current in three phases. Look for single-phase loads being fed from primarily one phase in the panel.
This redistribution and balancing has many benefits. It reduces the risk of overheating any particular phase in the transformer, minimizes neutral current, reduces the chances of nuisance breaker tripping, and provides other advantages in terms of maintenance and reliability.
12. To correct loose connections, use an infrared sensor to check for hot spots. Don’t use the method of retorquing to prevent loose connections. This nearly always results in over-torquing. A fastener does its job by stretching to near what is called its elastic limit. Once you exceed this, the fastener can never provide the clamping power it was designed to provide. And the clamping power is what allows that connection to be made tight. Once you exceed the elastic limit of a fastener, you have eliminated its ability to give you a reliable connection. Overtorquing can eventually strip threads. But, this does not mean you are okay as long as you don’t strip the threads. What matters is how far you stretched the fastener. Once you exceed the torque limit for that fastener, it will no longer fasten properly.
13. Examine connections on wireways. For electrical metallic tubing (EMT), check that the coupling screws are not loose. Don’t over tighten these. You cannot economically tighten conduit, as it’s threaded together.
14. For critical circuits, consider installing a bonding jumper around every metallic wireway connection. For example, install a bonding jumper around each conduit coupling or around each EMT fitting.
15. As already mentioned, remove any load-side N-G bonds.