AMAZON multi-meters discounts AMAZON oscilloscope discounts
cont. from part 1
6. ACTIVE BAND-STOP FILTERS
Band-stop filters reject a specified band of frequencies and pass all others. The response is opposite to that of a band-pass filter. Band-stop filters are sometimes referred to as notch filters.
After completing this section, you should be able to:
-- Describe basic types of active band-stop filters
-- Identify and describe a multiple-feedback band-stop filter
-- Identify and analyze the state-variable filter
Multiple-Feedback Band-Stop Filter
FIG. 24 shows a multiple-feedback band-stop filter. Notice that this configuration is similar to the band-pass version in FIG. 18 except that R3 has been moved and R4 has been added.
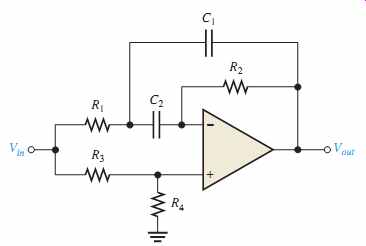
FIG. 24 Multiple-feedback band-stop filter.
State-Variable Band-Stop Filter
Summing the low-pass and the high-pass responses of the state-variable filter covered in Section 5 with a summing amplifier creates a band-stop filter, as shown in FIG. 25.
One important application of this filter is minimizing the 60 Hz "hum" in audio systems by setting the center frequency to 60 Hz.
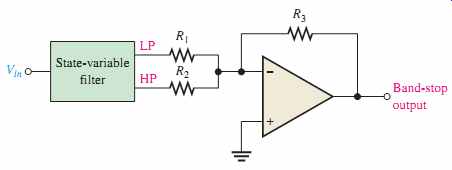
FIG. 25 State-variable band-stop filter.
SECTION 6 CHECKUP
1. How does a band-stop response differ from a band-pass response?
2. How is a state-variable band-pass filter converted to a band-stop filter?
7. FILTER RESPONSE MEASUREMENTS
Two methods of determining a filter's response by measurement are discrete point measurement and swept frequency measurement.
After completing this section, you should be able to:
-- Discuss two methods for measuring frequency response
-- Explain discrete-point measurement
-- List the steps in the procedure
-- Show a test setup
-- Explain swept frequency measurement
-- Show a test setup for this method using a spectrum analyzer
-- Show a test setup for this method using an oscilloscope
Discrete Point Measurement
FIG. 27 shows an arrangement for taking filter output voltage measurements at discrete values of input frequency using common laboratory instruments. The general procedure is as follows:
1. Set the amplitude of the sine wave generator to a desired voltage level.
2. Set the frequency of the sine wave generator to a value well below the expected critical frequency of the filter under test. For a low-pass filter, set the frequency as near as possible to 0 Hz. For a band-pass filter, set the frequency well below the expected lower critical frequency.
3. Increase the frequency in predetermined steps sufficient to allow enough data points for an accurate response curve.
4. Maintain a constant input voltage amplitude while varying the frequency.
5. Record the output voltage at each value of frequency.
6. After recording a sufficient number of points, plot a graph of output voltage versus frequency.
If the frequencies to be measured exceed the frequency response of the DMM, an oscilloscope may have to be used instead.
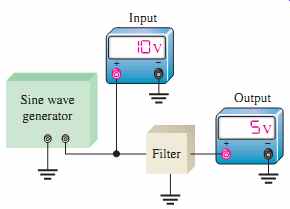
FIG. 27 Test setup for discrete point measurement of the filter response.
( Readings are arbitrary and for display only.)
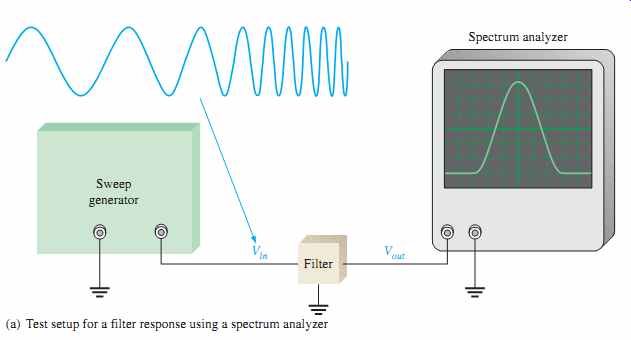
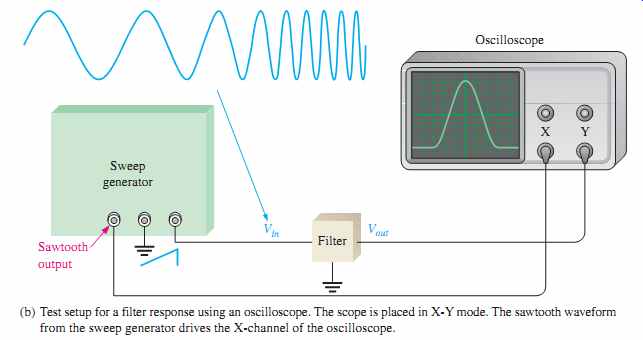
FIG. 28 Test setup for swept frequency measurement of the filter response.
(a) Test setup for a filter response using a spectrum analyzer
(b) Test setup for a filter response using an oscilloscope. The scope is placed in X-Y mode. The sawtooth waveform from the sweep generator drives the X-channel of the oscilloscope.
Swept Frequency Measurement
The swept frequency method requires more elaborate test equipment than does the discrete point method, but it is much more efficient and can result in a more accurate response curve. A general test setup is shown in FIG. 28(a) using a swept frequency generator and a spectrum analyzer. FIG. 28(b) shows how the test can be made with an oscilloscope.
The swept frequency generator produces a constant amplitude output signal whose frequency increases linearly between two preset limits, as indicated in FIG. 28. The spectrum analyzer is essentially an elaborate oscilloscope that can be calibrated for a de sired frequency span/division rather than for the usual time/division setting. Therefore, as the input frequency to the filter sweeps through a preselected range, the response curve is traced out on the screen of the spectrum analyzer or an oscilloscope.
SECTION 7 CHECKUP
1. What is the purpose of the two tests discussed in this section?
2. Name one disadvantage and one advantage of each test method.
Application Activity: RFID System
RFID (radio frequency identification) is a technology that enables the tracking and/or identification of objects. Typically, an RFID system contains an RFID tag that consists of an IC chip that transmits data about the object, an RFID reader that receives transmitted data from the tag, and a data-processing system that processes and stores the data passed to it by the reader. A basic block diagram is shown in FIG. 29.
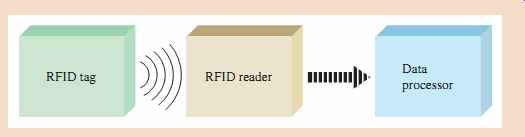
FIG. 29 Basic block diagram of an RFID system.
The RFID Tag
RFID tags are tiny, very thin microchips with memory and a coil antenna. The tags listen for a radio signal sent by an RFID reader. When a tag receives a signal, it responds by transmitting its unique ID code and other data back to the reader.
Passive RFID Tag
This type of tag does not require batteries. The tag is inactive until powered by the energy from the electromagnetic field of an RFID reader. Passive tags can be read from distances up to about 20 feet and are generally read-only, meaning the data they contain cannot be altered or written over.
Active RFID Tag
This type of tag is powered by a battery and is capable of communicating up to 100 feet or more from the RFID reader. Generally, the active tag is larger and more expensive than a passive tag, but can hold more data about the product and is commonly used for identification of high-value assets. Active tags may be read-write, meaning the data they contain can be written over.
Tags are available in a variety of shapes. Depending on the application, they may be embedded in glass or epoxy, or they may be in label or card form. Another type of tag, often called the smart label, is a paper (or similar material) label with printing, but also with the RF circuitry and antenna embedded in it.
Some advantages of RFID tags compared to bar codes are:
-- Non-line-of-sight identification
-- More information can be stored
-- Coverage at greater distances
-- Unattended operations are possible
-- Ability to identify moving objects that have tags embedded
-- Can be used in diverse environments
Disadvantages of RFID tags are that they are expensive compared to the bar code and they are bulkier because the electronics is embedded in the tag.
RFID tags and readers must be tuned to the same frequency to communicate. RFID systems use many different frequencies, but generally the most common are low frequency (125 kHz), high frequency (13.56 MHz), and ultra-high frequency, or UHF (850-900 MHz).
Microwave (2.45 GHz) is also used in some applications. The frequency used depends on the particular type of application.
Low-frequency systems are the least expensive and have the shortest range. They are most commonly used in security access, asset tracking, and animal identification applications. High-frequency systems are used for applications such as railroad car tracking and automated toll collection.
Some typical RFID application areas are:
-- Metering applications such as electronic toll collection
-- Inventory control and tracking such as merchandise control
-- Asset tracking and recovery
-- Tracking parts moving through a manufacturing process
-- Tracking goods in a supply chain The RFID Reader
Data is stored on the RFID tag in digital form and is transmitted to the reader as a modulated signal. Many RFID systems use ASK (amplitude shift keying) or FSK (frequency shift keying). In ASK, the amplitude of a carrier signal is varied by the digital data. In FSK, the frequency of a carrier signal is varied by the digital data. Examples of these forms of modulation are shown FIG. 30. In this system, the carrier is 125 kHz, and the modulating signal is a digital waveform at the rate of 10 kHz, representing a stream of 1s and 0s.
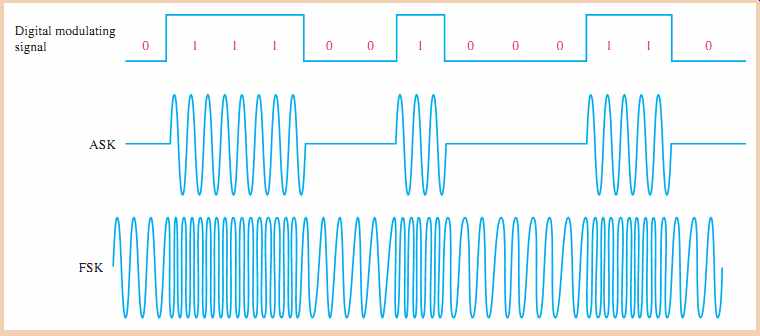
FIG. 30 Examples of ASK and FSK modulation transmitted by an RFID tag.
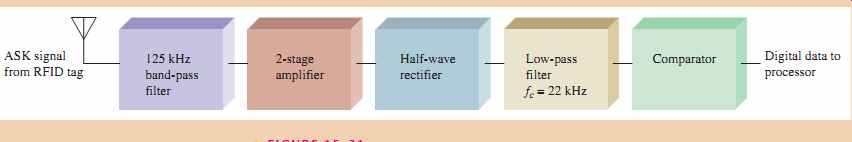
FIG. 31 Block diagram of RFID reader.
Project
Your company is developing a new RFID reader using ASK modulation at a carrier frequency of 125 kHz. A block diagram is shown in FIG. 31. The purpose of each block is as follows. The band-pass filter passes the 125 kHz signal and reduces signals and noise from other sources; the 2-stage amplifier increases the very small signal from the tag to a usable level; the rectifier eliminates the negative portions of the modulated signal; the low-pass filter eliminates the 125 kHz carrier frequency but passes the 10 kHz modulating signal; and the comparator restores the digital signal to a usable stream of digital data.
1. In general, what are RFID systems used for?
2. Name the three basic components of an RFID system.
3. Explain the purpose of an RFID tag.
4. Explain the purpose of an RFID reader.
Simulation
The RFID reader is simulated with Multisim using an input signal of 1 mV at 125 kHz to represent the output of the RFID tag. For purposes of simulation, the 125 kHz carrier is modulated with a 10 kHz sine wave although the actual modulating signal will be a pulse waveform containing digital data. In Multisim it is difficult to produce a sinusoidal carrier signal modulated with a pulse signal, so the sinusoidal modulating signal serves to verify system operation. The simulated circuit is shown in FIG. 32. The band-pass filter is U1, the amplifier stages are U2 and U3, the half-wave rectifier is D1, the low-pass filter is U4, and the comparator is U5. Datasheets for the OP27AH op-amp and the LM111H comparator are available at www.analog.com.
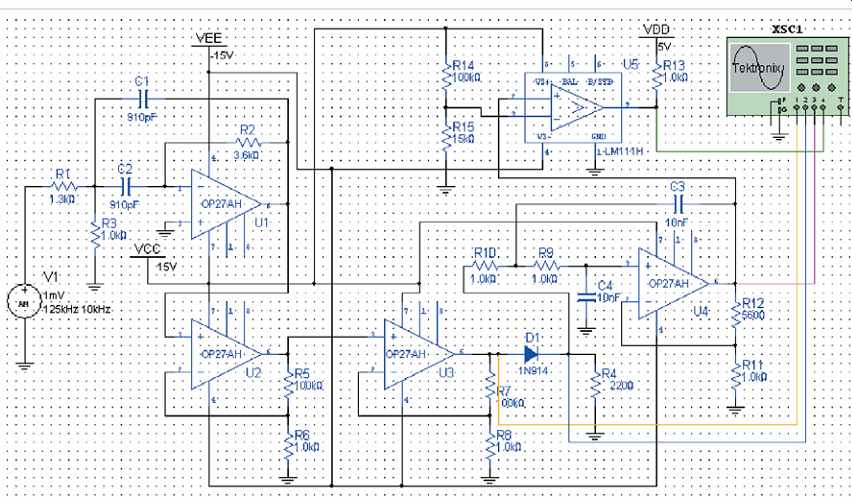
FIG. 32 Simulated circuit screen for the RFID reader.
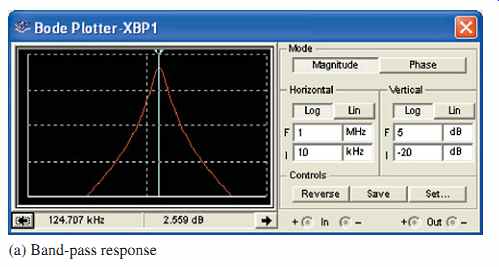
FIG. 33 Bode plots for the RFID reader filters.
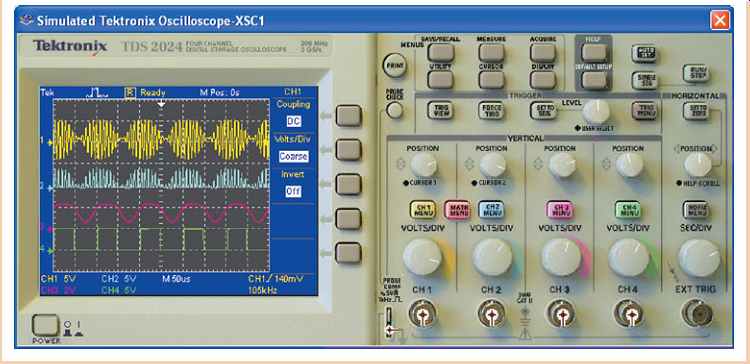
FIG. 34 RFID reader waveforms.
The frequency responses of the band-pass filter and the low-pass filter are shown on the Bode plotters in FIG. 33. As you can see, the peak response of the band-pass filter is approximately 125 kHz and the critical frequency of the low-pass filter is approximately 16 kHz.
5. What is the purpose of the band-pass filter in the RFID reader?
6. What is the purpose of the low-pass filter in the RFID reader?
7. Calculate the gain of each amplifier in the reader in FIG. 32.
8. Use the formula for a multiple-feedback band-pass filter to verify the center frequency of the band-pass filter in the reader.
9. What type of response characteristic is the low-pass filter set up for?
10. Calculate the critical frequency of the low-pass filter and compare to the measured value.
11. Calculate the reference voltage for the comparator and explain why a reference above ground is necessary.
Measurements at points on the reader circuit are shown on the oscilloscope in FIG. 34. The top waveform is the modulated carrier at the output of amplifier U3. The second waveform is the output of the rectifier D1. The third waveform is the output of the low-pass filter (notice that the carrier frequency has been removed by the filter). The bottom wave form is the output of the comparator and represents the digital data sent to the processor.
Prototyping and Testing
Now that the circuit has been simulated, the prototype circuit is constructed and tested.
After the circuit is successfully tested on a protoboard, it is ready to be finalized on a printed circuit board.
Lab Experiment----To build and test a low-pass filter similar to one used in the RFID reader.
Circuit Board
The RFID reader circuit is implemented on a printed circuit board as shown in FIG. 35. The dark gray lines represent backside traces.
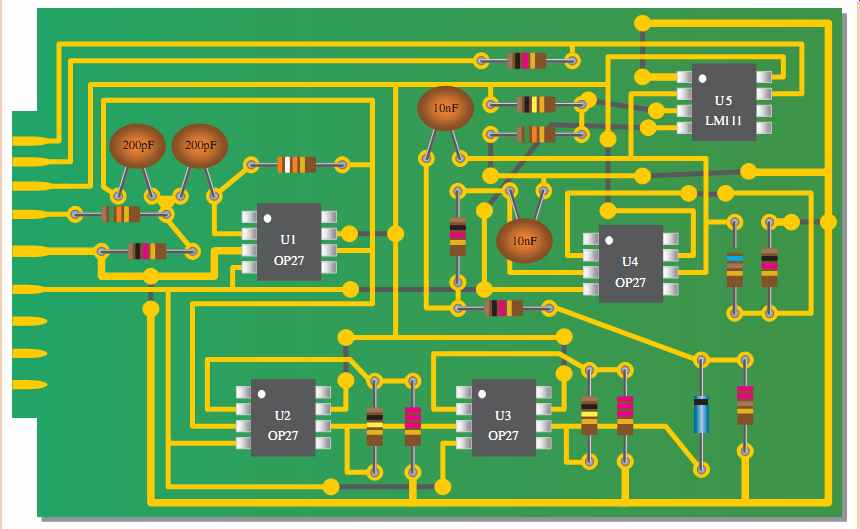
FIG. 35 RFID reader board.
12. Check the printed circuit board and verify that it agrees with the simulation schematic in FIG. 32.
13. Label each input and output pin according to function.
----------------------
---------------------
Programmable Analog Technology
The material you have learned in this section is necessary to give you a basic understanding of active filters. However, filter design can be quite complex mathematically. To avoid tedious calculations and trial-and-error breadboarding, the preferred method for development of many filters is to use computer software and then download the design to a programmable analog array. Software is used in this section to illustrate the ease with which active filters can be developed and implemented in hardware. If you have checked out the optional Programmable Analog Technology feature, you are aware that this software is available and can be downloaded free from www.anadigm.com. You can easily implement a filter design in an FPAA or dpASP chip if you have an evaluation board and interface cable connected to your computer.
Filter Specification
Once you have downloaded the software, the first thing you see when opening it is an outline representation of the blank FPAA chip, as shown in FIG. 36. Under the Tools menu, select AnadigmFilter, as shown, and you will get the screen shown in FIG. 37.
You are now ready to specify a filter. For example, select a filter type and approximation and enter the desired parameters, as shown in FIG. 38, for a band-pass Butterworth filter. Note that you can use your mouse to drag the limits, shown in red and blue on the screen, to set the desired response.
When the filter has been completely specified, click on "To AnadigmDesigner2" and the filter components will be placed in the FPAA chip screen, as shown in FIG. 39(a). Notice that the filter consists of three stages, in this case. Now use the connection tool to connect the filter to an input and output, as shown in part (b).
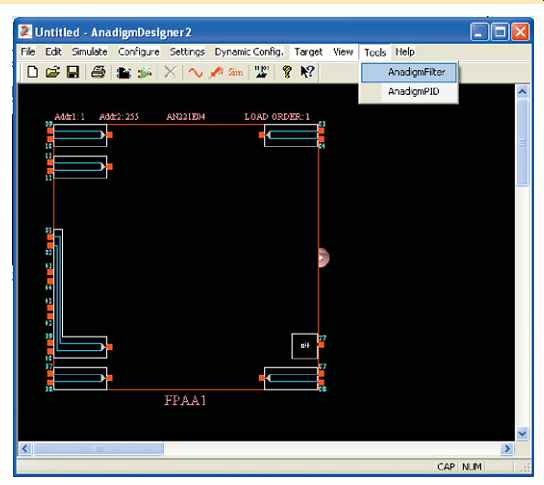
FIG. 36 FPAA chip outline screen showing AnadigmFilter selection.
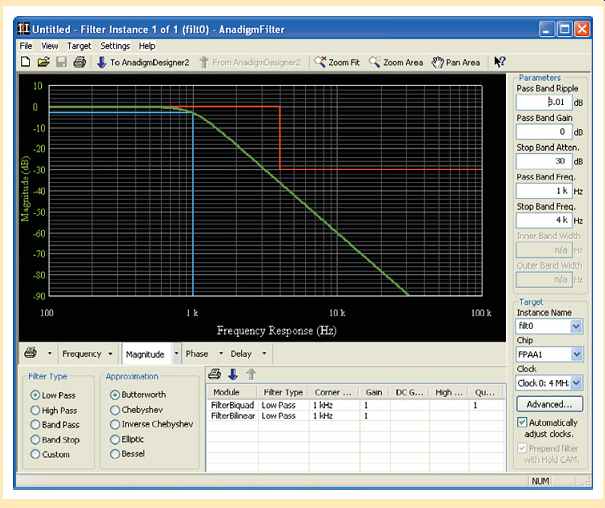
FIG. 37 Filter default screen.
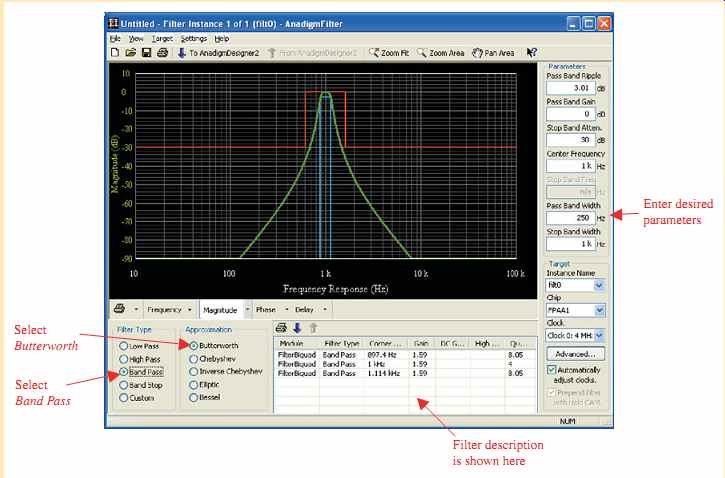
Fig. 38.
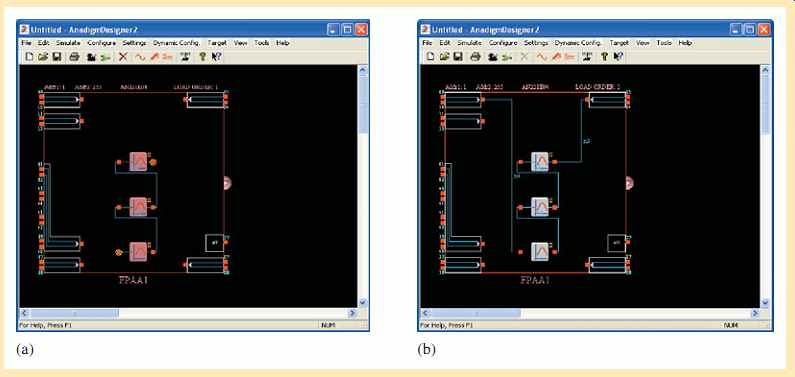
FIG. 39
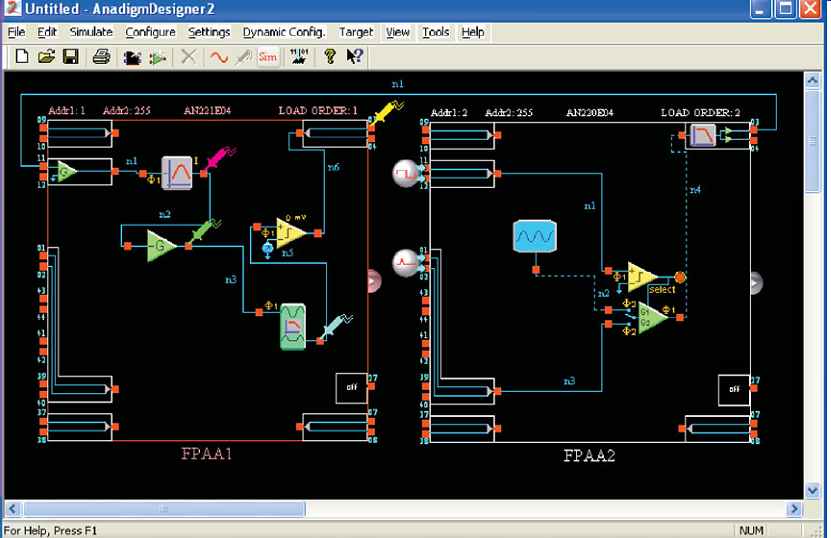
FIG. 40 Design screen showing the RFID reader in FPAA1 and an ASK generator
representing the RFID tag in FPAA2.
By attaching actual signal generators and oscilloscope probes to the board, you can verify that the downloaded circuit is behaving just as the simulator indicated it would. Note that an FPAA or dpASP is reprogrammable so you can make circuit changes, download, and test indefinitely.
Design Assignment
Implement the RFID reader circuit using software.
Procedure: FIG. 40 shows a version of the circuit implemented in FPAA1. Because of limitations on implementing the ASK input signal, modifications have been made. Since the input cell contains an amplifier with gain, the amplifier in the RFID reader circuit has less gain than if a 1 mV ASK signal were available. Also, the rectifier and low-pass filter are combined in one CAM.
FPAA2 is used as a signal source to replicate a 125 kHz carrier modulated with a 10 kHz square wave. This chip is for test purposes only and is not part of the RFID reader.
Analysis: The simulation of the RFID reader is shown in FIG. 41. The top waveform is the output of the 125 kHz band-pass filter CAM and is an ASK input signal representing a digital 1 followed by a 0. The second waveform is the output of the inverting gain stage CAM with a unity gain. The third waveform is the output of the half-wave rectifier/low-pass filter CAM. The bottom output is the digital signal from the comparator.
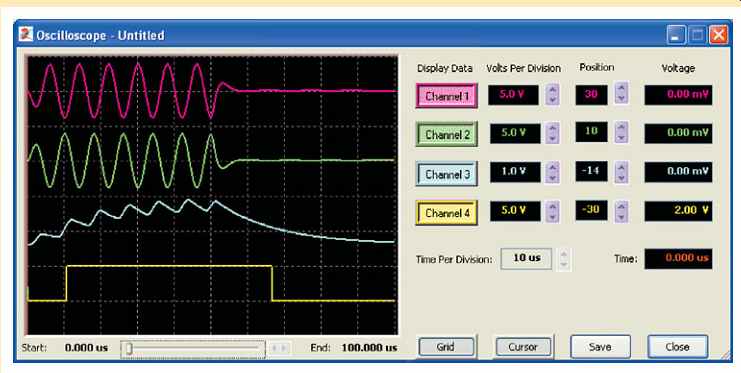
FIG. 41 Simulation waveforms for the RFID reader.
---------------------
SUMMARY
Section 1
-- In filter terminology, a single RC circuit is called a pole.
-- The bandwidth in a low-pass filter equals the critical frequency because the response extends to 0 Hz.
-- The passband of a high-pass filter extends above the critical frequency and is limited only by the inherent frequency limitation of the active circuit.
-- A band-pass filter passes all frequencies within a band between a lower and an upper critical frequency and rejects all others outside this band.
-- The bandwidth of a band-pass filter is the difference between the upper critical frequency and the lower critical frequency.
-- The quality factor Q of a band-pass filter determines the filter's selectivity. The higher the Q, the narrower the bandwidth and the better the selectivity.
-- A band-stop filter rejects all frequencies within a specified band and passes all those outside this band.
Section 2
-- Filters with the Butterworth response characteristic have a very flat response in the passband, exhibit a roll-off of -20 dB/decade/pole and are used when all the frequencies in the passband must have the same gain.
-- Filters with the Chebyshev characteristic have ripples or overshoot in the passband and exhibit a faster roll-off per pole than filters with the Butterworth characteristic.
-- Filters with the Bessel characteristic are used for filtering pulse waveforms. Their linear phase characteristic results in minimal waveshape distortion. The roll-off rate per pole is slower than for the Butterworth.
-- Each pole in a Butterworth filter causes the output to roll off at a rate of -20 dB/decade.
-- The damping factor determines the filter response characteristic (Butterworth, Chebyshev, or Bessel).
Section 3
-- Single-pole low-pass filters have a -20 dB/decade roll-off.
-- The Sallen-Key low-pass filter has two poles (second order) and has a -40 dB/decade roll-off.
-- Each additional filter in a cascaded arrangement adds to the roll-off rate.
Section 4
-- Single-pole high-pass filters have a -20 dB/decade roll-off.
-- The Sallen-Key high-pass filter has two poles (second order) and has a -40 dB/decade roll-off.
-- Each additional filter in a cascaded arrangement adds to the -20 dB/decade roll-off rate.
-- The response of an active high-pass filter is limited by the internal op-amp roll-off.
Section 5
-- Band-pass filters pass a specified band of frequencies.
-- A band-pass filter can be achieved by cascading a low-pass and a high-pass filter.
-- The multiple-feedback band-pass filter uses two feedback paths to achieve its response characteristic.
-- The state-variable band-pass filter uses a summing amplifier and two integrators.
-- The biquad filter consists of an integrator followed by an inverting amplifier and a second integrator.
Section 6
-- Band-stop filters reject a specified band of frequencies.
-- Multiple-feedback and state-variable are common types of band-stop filters.
Section 7
-- Filter response can be measured using discrete point measurement or swept frequency measurement.
TERMINOLOGY
Band-pass filter --A type of filter that passes a range of frequencies lying between a certain lower frequency and a certain higher frequency.
Band-stop filter --A type of filter that blocks or rejects a range of frequencies lying between a certain lower frequency and a certain higher frequency.
Damping factor --A filter characteristic that determines the type of response.
Filter --A circuit that passes certain frequencies and attenuates or rejects all other frequencies.
High-pass filter --A type of filter that passes frequencies above a certain frequency while rejecting lower frequencies.
Low-pass filter-- A type of filter that passes frequencies below a certain frequency while rejecting higher frequencies.
Pole --A circuit containing one resistor and one capacitor that contributes to a filter's roll-off rate.
Roll-off --The rate of decrease in gain, below or above the critical frequencies of a filter.
FORMULAS
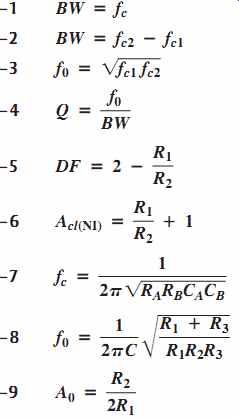
- Low-pass bandwidth
- Filter bandwidth of a band-pass filter
- Center frequency of a band-pass filter
- Quality factor of a band-pass filter
- Damping factor
- Closed-loop voltage gain
- Critical frequency for a second-order Sallen-Key filter
- Center frequency of a multiple-feedback filter
- Gain of a multiple-feedback filter
TRUE/FALSE QUIZ
1. The response of a filter can be identified by its passband.
2. A filter pole is the cutoff frequency of a filter.
3. A single-pole filter has one RC circuit.
4. A single-pole filter produces a roll-off of -25 dB/decade.
5. A low-pass filter can pass a dc voltage.
6. A high-pass filter passes any frequency above dc.
7. The critical frequency of a filter depends only on R and C values.
8. The band-pass filter has two critical frequencies.
9. The quality factor of a band-pass filter is the ratio of bandwidth to the center frequency.
10. The higher the Q, the narrower the bandwidth of a band-pass filter.
11. The Butterworth characteristic provides a flat response in the passband.
12. Filters with a Chebyshev response have a slow roll-off.
13. A Chebyshev response has ripples in the passband.
14. Bessel filters are useful in filtering pulse waveforms.
15. The order of a filter is the number of poles it contains.
16. A Sallen-Key filter is also known as a VCVS filter.
17. Multiple feedback is used in low-pass filters.
18. A state-variable filter uses differentiators.
19. A band-stop filter rejects certain frequencies.
20. Filter response can be measured using a sweep generator.
CIRCUIT QUIZ
1. If the critical frequency of a low-pass filter is increased, the bandwidth will (a) increase (b) decrease (c) not change
2. If the critical frequency of a high-pass filter is increased, the bandwidth will (a) increase (b) decrease (c) not change
3. If the Q of a band-pass filter is increased, the bandwidth will (a) increase (b) decrease (c) not change
4. If the value of CA and CB in FIG. 11 are increased by the same amount, the critical frequency will (a) increase (b) decrease (c) not change
5. If the value of R2 in FIG. 11 is increased, the bandwidth will (a) increase (b) decrease (c) not change
6. If two filters like the one in FIG. 15 are cascaded, the roll-off rate of the frequency response will (a) increase (b) decrease (c) not change
7. If the value of R2 in FIG. 19 is decreased, the Q will (a) increase (b) decrease (c) not change
8. If the capacitors in FIG. 19 are changed to 0.022 uF, the center frequency will (a) increase (b) decrease (c) not change
TEST
Section 1.
The term pole in filter terminology refers to (a) a high-gain op-amp (b) one complete active filter (c) a single RC circuit (d) the feedback circuit
2. A single resistor and a single capacitor can be connected to form a filter with a roll-off rate of (a) -20 dB/decade (b) -40 dB/decade (c) -6 dB/octave (d) answers (a) and (c)
3. A band-pass response has (a) two critical frequencies (b) one critical frequency (c) a flat curve in the passband (d) a wide bandwidth
4. The lowest frequency passed by a low-pass filter is (a) 1 Hz (b) 0 Hz (c) 10 Hz (d) dependent on the critical frequency
5. The quality factor (Q) of a band-pass filter depends on (a) the critical frequencies (b) only the bandwidth (c) the center frequency and the bandwidth (d) only the center frequency Section 2
6. The damping factor of an active filter determines (a) the voltage gain (b) the critical frequency (c) the response characteristic (d) the roll-off rate
7. A maximally flat frequency response is known as (a) Chebyshev (b) Butterworth (c) Bessel (d) Colpitts
8. The damping factor of a filter is set by (a) the negative feedback circuit (b) the positive feedback circuit (c) the frequency-selective circuit (d) the gain of the op-amp
9. The number of poles in a filter affect the (a) voltage gain (b) bandwidth (c) center frequency (d) roll-off rate
Section 3
10. Sallen-Key low-pass filters are (a) single-pole filters (b) second-order filters (c) Butterworth filters (d) band-pass filters 11. When low-pass filters are cascaded, the roll-off rate (a) increases (b) decreases (c) does not change
Section 4
12. In a high-pass filter, the roll-off occurs (a) above the critical frequency (b) below the critical frequency (c) during the mid range (d) at the center frequency
13. A two-pole Sallen-Key high-pass filter contains (a) one capacitor and two resistors (b) two capacitors and two resistors (c) a feedback circuit (d) answers (b) and (c)
Section 5
14. When a low-pass and a high-pass filter are cascaded to get a band-pass filter, the critical frequency of the low-pass filter must be (a) equal to the critical frequency of the high-pass filter (b) less than the critical frequency of the high-pass filter (c) greater than the critical frequency of the high-pass filter
15. A state-variable filter consists of (a) one op-amp with multiple-feedback paths (b) a summing amplifier and two integrators (c) a summing amplifier and two differentiators (d) three Butterworth stages
Section 6
16. When the gain of a filter is minimum at its center frequency, it is:
(a) a band-pass filter (b) a band-stop filter (c) a notch filter (d) answers (b) and (c)
PROBLEMS
BASIC PROBLEMS
Section 1--Basic Filter Responses
1. Identify each type of filter response (low-pass, high-pass, band-pass, or band-stop) in FIG. 42.
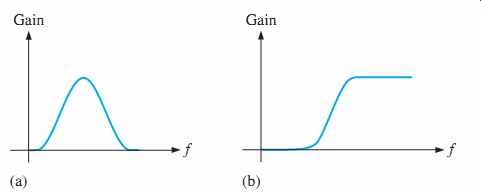
FIG. 42
2. A certain low-pass filter has a critical frequency of 800 Hz. What is its bandwidth?
3. A single-pole high-pass filter has a frequency-selective circuit with R = 2.2 k-OHM and C = 0.0015 mF. What is the critical frequency? Can you determine the bandwidth from the available information?
4. What is the roll-off rate of the filter described in Problem 3?
5. What is the bandwidth of a band-pass filter whose critical frequencies are 3.2 kHz and 3.9 kHz? What is the Q of this filter?
6. What is the center frequency of a filter with a Q of 15 and a bandwidth of 1 kHz?
Section 2--Filter Response Characteristics
7. What is the damping factor in each active filter shown in FIG. 43? Which filters are approximately optimized for a Butterworth response characteristic?
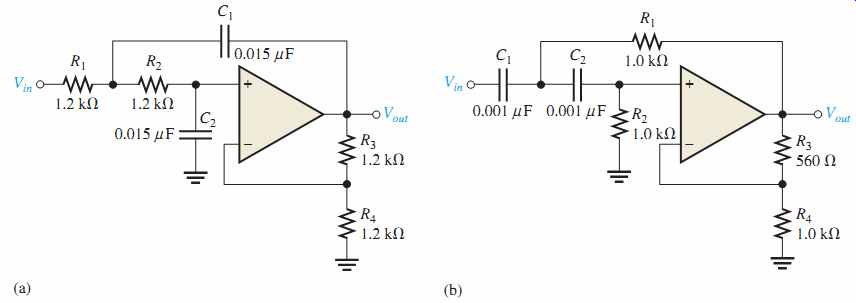
FIG. 43 Sim file circuits are identified with a logo. Filenames correspond
to figure numbers (e.g., F15-43).
8. For the filters in FIG. 43 that do not have a Butterworth response, specify the changes necessary to convert them to Butterworth responses. (Use nearest standard values.)
9. Response curves for second-order filters are shown in FIG. 44. Identify each as Butterworth. Chebyshev, or Bessel.
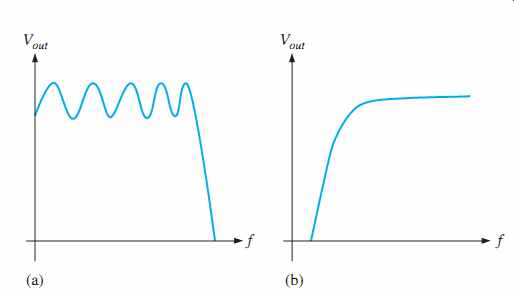
FIG. 44
Section 3--Active Low-Pass Filters
10. Is the four-pole filter in FIG. 45 approximately optimized for a Butterworth response? What is the roll-off rate?
11. Determine the critical frequency in FIG. 45.
12. Without changing the response curve, adjust the component values in the filter of FIG. 45 to make it an equal-value filter. Select C = 0.22 uF for both stages.
13. Modify the filter in FIG. 45 to increase the roll-off rate to -120 dB/decade while maintaining an approximate Butterworth response.
14. Using a block diagram format, show how to implement the following roll-off rates using single-pole and two-pole low-pass filters with Butterworth responses.
(a) -40 dB/decade (b) -20 dB/decade (c) -60 dB/decade (d) -100 dB/decade (e) -120 dB/decade
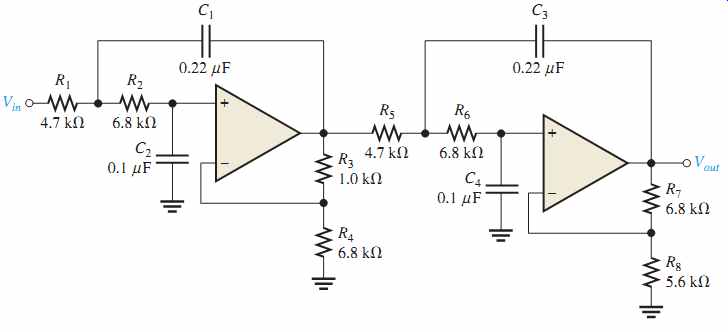
FIG. 45
Section 4--Active High-Pass Filters
15. Convert the filter in Problem 12 to a high-pass with the same critical frequency and response characteristic.
16. Make the necessary circuit modification to reduce by half the critical frequency in Problem 15.
17. For the filter in FIG. 46, (a) how would you increase the critical frequency? (b) How would you increase the gain?
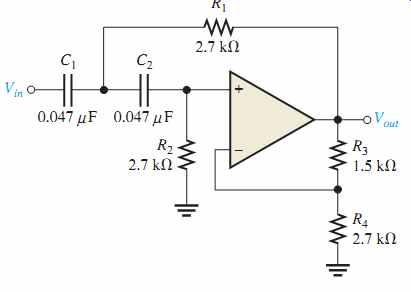
FIG. 46
Section 5--Active Band-Pass Filters
18. Identify each band-pass filter configuration in FIG. 47.
19. Determine the center frequency and bandwidth for each filter in FIG. 47.
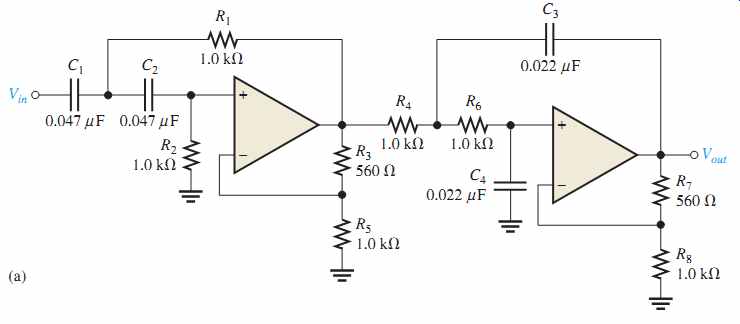
FIG. 47
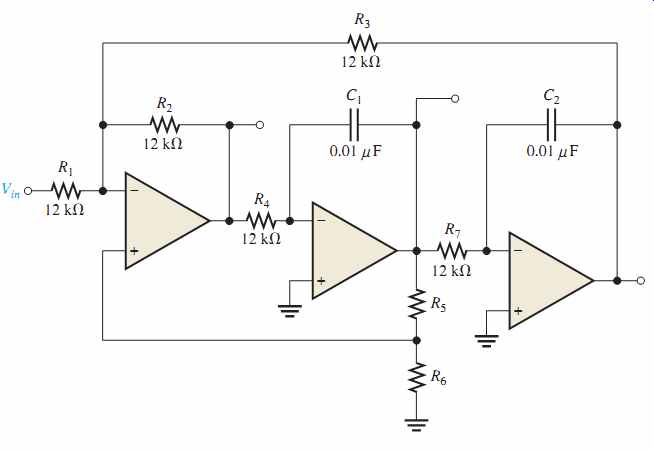
FIG. 48
20. Optimize the state-variable filter in FIG. 48 for Q = 50. What bandwidth is achieved?
Section 6--Active Band-Stop Filters
21. Show how to make a notch (band-stop) filter using the basic circuit in FIG. 48.
22. Modify the band-stop filter in Problem 21 for a center frequency of 120 Hz.