AMAZON multi-meters discounts AMAZON oscilloscope discounts
5. Water Flow
Kinetic energy turbines, also called free-flow turbines, generate electricity from the kinetic energy of the flowing water, similar to wind turbines, which generate energy from the flowing air. Systems are also referred to as hydrokinetic, tidal in-stream energy conversion (TISEC), or river in-stream energy conversion (RISEC). The systems may operate in rivers, tides, ocean currents, or even channels or conduits for water. Kinetic systems don’t require large civil works, and they can be placed near existing structures such as bridges, tailraces, and channels that increase the natural flow of water. For tidal currents, unidirectional turbines are available; rotation is the same, even though current is from opposite directions. One hydrokinetic system has a hydraulic pump to drive an onshore electric generator. Kinetic energy turbines would have less environmental impact than dams, and like wind turbines, they are modular and can be installed in a short time compared to large civil structures.
===
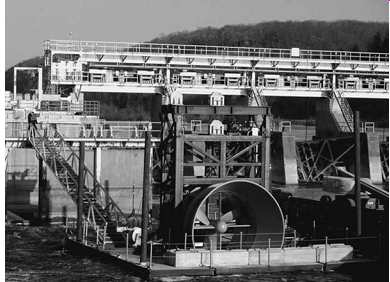
Above: Fig. 12 In-river system, 250 kW, on Mississippi River, Hastings, Minnesota.
(Hydro Green, Houston, TX.)
===
The power/area is proportional to the cube of the velocity (Equation 4). Large rivers have large flows, and the Amazon, with an average flow of 210,000 m^3 /s, has around 20% of the river flow of the world.
At the narrows of Óbidos, 600 km from the sea, the Amazon narrows to a single stream that is 1.6 km wide and over 60 m deep and has a speed of 1.8-2.2 m/s. At New Orleans, the speed of the Mississippi is 1.3 m/s, and some sections of the river have flows of 2.2 m/s. At Hastings, Minnesota, a 250-kW hydro kinetic unit located below a dam (4.4 MW hydroelectric) was placed in operation in 2008. The ducted rotor is suspended from a barge with the generator on the barge (Fig.12).
The United States could produce 13,000 MW of power from hydrokinetic energy by 2025. As of March 2010, the Federal Energy Regulatory Commission (FERC) had issued 134 preliminary permits for hydrokinetic projects ( Fig.13) with a total capacity of 9864 MW. Notice that many of the permits are on the Mississippi River.
The FERC requires consideration of any environmental effects of the proposed construction, installation, operation, and removal of the project. The description should include:
1. Any physical disturbance (vessel collision or other project-related risks for fish, marine mammals, seabirds, and other wildlife as applicable)
2. Species-specific habitat creation or displacement
3. Increased vessel traffic
4. Exclusion or disturbance of recreational, commercial, industrial, or other uses of the waterway and changes in navigational safety
5. Any above- or below-water noise disturbance, including estimated decibel levels during project construction, installation, operation, and removal
6. Any electromagnetic field disturbance
7. Any changes in river or tidal flow, wave regime, or coastal or other geomorphic processes
8. Any accidental contamination from device failures, vessel collisions, and storm damage
9. Chemical toxicity of any component of, or bio-fouling coating on, the project devices or trans mission line
10. Any socioeconomic effects on the commercial fishing industry from potential loss of harvest or effect on access routes to fishing grounds An important factor for water f low is that, at good locations, power won’t vary like that of wind turbines, especially for in-river locations, so capacity factors can be much higher. One manufacturer stated that capacity factors should be at least 30% for tides and 50% for in-river systems. As always, the final result for comparison is the cost per kilowatt hour, which should be life-cycle costs.
====
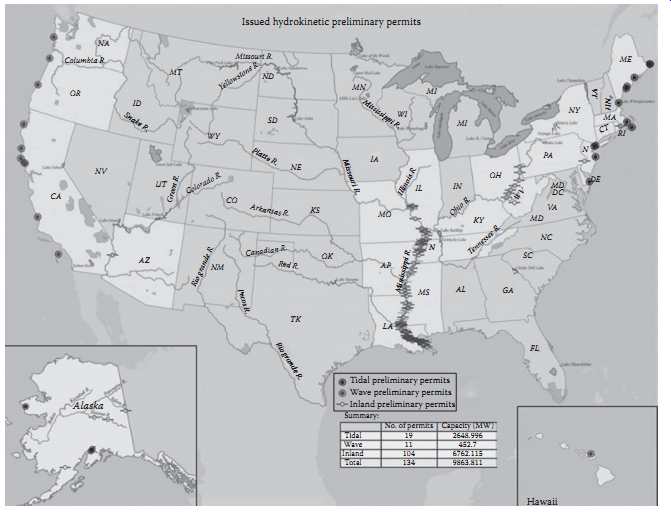
Above: Fig. 13 Proposed locations for hydrokinetic projects in the United
States, March 2010. (From Federal Energy Regulatory Commission, Washington,
DC.) Issued hydrokinetic preliminary permits
===
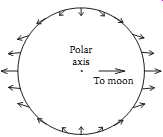
Above: Fig. 14 Tidal forces on the Earth due to the moon. Polar axis; To
moon
===

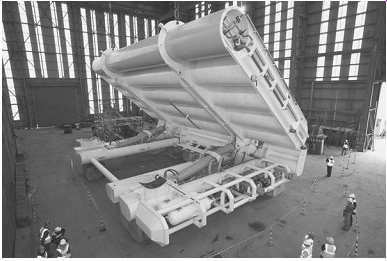
Above: Fig. 15 Tidal turbine, 35 kW, being installed in East River, New York
City. (--Verdant Power, New York.)
===
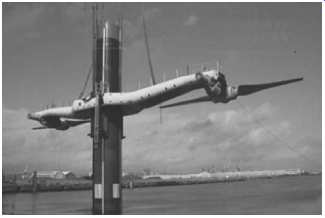
Above: Fig. 16 Tidal system, 1.2 MW, in Strangford Narrows, Northern Ireland.
(--Sea Generation, Bristol, U.K.)
===
6. Tides
Tides are due to the gravitational attraction of the moon and the sun at the surface of the Earth. The effect of the moon on the Earth in terms of tides is larger than the effect of the sun, even through the gravitational force of the sun is larger. To find how the gravitational force of the moon distorts any volume of the material body of the Earth, the gradient of the gravitational force of the moon on that volume must be found (a gradient is how force changes with distance; in calculus, it’s the differentiation with respect to length). The tidal effects (Fig.14) are superimposed on the near-spherical Earth, and there will be two tides per day due to the spin of Earth. When the tidal effects of the sun and moon are aligned, the tides are higher, spring tides. When the continents are added, the ocean bulges reflect from shorelines, which causes currents, resonant motions, and standing waves, so there are some places in the oceans where the tidal variations are nearly zero. In other locations, the coastal topography can intensify water heights with respect to the land. The largest tidal ranges in the world are the Bay of Fundy (11.7 m), Ungava Bay (9.75 m), Bristol Channel (9.6 m), and the Turnagain Arm of Cook Inlet, Alaska (9.2 m). The potential world tidal current energy is on about 2200 TWh/year.
Small mills were used on tidal sections of rivers in the Middle Ages for grinding grain. Today, there are only a few tidal systems installed in the world: the French installed a tidal system on the Rance Estuary (constructed from 1961 to 1967) with a power of 240 MW; an 18-MW rim generator at Annapolis Royal, Nova Scotia, Canada (1984); a 400-kW unit in the Bay of Kislaya, Russia (1968); and a 500-kW unit at Jangxia Creek, East China Sea.
The simplest system for generation of electricity is an ebb system, which involves a dam, known as a barrage, across an estuary. Barrages make use of the potential energy in the difference in height between high and low tides. Sluice gates on the barrage allow the tidal basin to fill on high tides (flood tide) and to generate power on the outgoing tide (ebb tide). Flood generating systems generate power from both tides but are less favored than ebb generating systems. Barrages across the full width of a tidal estuary have high civil infrastructure costs, there is a worldwide shortage of viable sites, and there are more environmental issues.
Tidal lagoons are similar to barrages but can be constructed as self-contained structures, not fully across an estuary, and generally have much lower cost and environmental impact. Furthermore, they can be con figured to generate continuously, which is not the case with barrages. Different tidal systems, installed and proposed plants, and prototype and demonstration projects are given in Ref.
The potential for tidal in-stream systems was estimated at 692 MW for five states in the United States. A kinetic energy demonstration project ( Fig.15) is installed in the East River, New York City, and consists of two 35-kW turbines, 5-m diameter, with passive yaw. In 9000 h of operation, the sys tem generated 70 MWh. Another prototype, SeaGen, is installed in Strangford Narrows, Northern Ireland, with rated power of 1.2 MW at a current velocity of 2.4 m/s and with twin 16-m diameter rotors ( Fig.16). The rotor blades can be pitched through 180° to generate power on both ebb and food tides.
The twin power units are mounted on winglike extensions on a tubular steel monopole, and the system can be raised above sea level for maintenance. Kinetic energy systems are being considered because of the lower cost, lower ecological impact, increased availability of sites compared to barrages, and shorter time for installation.
Advantages for tidal systems are as follows:
1. Renewable
2. Predictable
Disadvantages or problems are as follows:
1. A barrage across an estuary is expensive and affects a wide area.
2. The environment is changed upstream and downstream for some distance. Many birds rely on the tide uncovering the mudflats so that they can feed. Fish ladders are needed.
3. There is intermittent power as power is available for around 10 h each day when the tide is moving in or out.
4. There are few suitable sites for tidal barrages.
7. Ocean
As with other renewable resources, the ocean energy is large. The global technical resource exploit able with today's technology is estimated to be 20,000 TWh/year for ocean currents, 45,000 TWh/year for wave energy, 33,000 TWh/year for ocean thermal energy conversion (OTEC), and 20,000 TWh/year for salinity gradient energy. Of course, economics and other factors will greatly reduce the potential production, and future actual energy production will be even smaller.
Besides the environmental considerations mentioned, there are a number of technical challenges for ocean energy to be utilized at a commercial scale:
- Avoidance of cavitations (bubble formation)
- Prevention of marine growth buildup
- Reliability (since maintenance costs may be high)
- Corrosion resistance
7.1 Currents
There are large currents in the ocean ( Fig.17), and detailed information on surface currents by ocean is available [18, only Atlantic and Polar at this time]. For example, the Gulf Stream transports a significant amount of warm water toward the North Atlantic and the coast of Europe. The core of the Gulf Stream current is about 90 km wide and has peak velocities greater than 2 m/s. The relatively constant extractable energy density near the surface of the Gulf Stream, the Florida Straits Current, is about 1 kW/m^2. Although the volume and velocity are adequate for in-stream hydro-kinetic systems, an ocean current would need to be close to the shore.
==
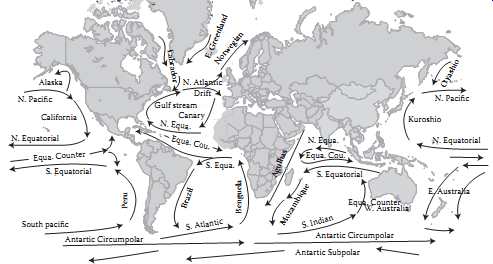
Above: Fig. 17 Major ocean currents in the world.
==
The total world power in ocean currents has been estimated to be about 5000 GW, with power densities of up to 15 kW/m^2. The European Union, Japan, and China are interested in and pursuing the application of ocean current energy systems.
7.2 Waves
Waves are created by the progressive transfer of energy from the wind as it blows over the surface of the water. Once created, waves can travel large distances without much reduction in energy. The energy in a wave is proportional to the height squared. In data for wave heights, be sure to note that height is for crest to trough, and amplitude is midpoint to crest.
... where H is wave height. This is for a single wave, but in the ocean, there is superposition of waves, and the energy transported is by group velocity. The speed of the wave, wave length, and frequency (or period, which is 1/frequency) are related by
Speed Wavelength( ) * Frequency ( ) = ? f
In deep water where the water depth is larger than half the wavelength, the power per length (meter) of the wave front is given by ....
where T is the period of the wave (time it takes for successive crests to pass one point). In major storms, the largest waves offshore are about 15 m high and have a period of about 15s, so the power is large, around 1.7 MW/m.
Example 4:
Calculate power/length for waves off New Zealand if the average wave height is 7 m with a wave period of 8 s. The power/length is ...
An effective wave energy system should capture as much energy as possible of the wave energy. As a result, the waves will be of lower height in the region behind the system. Offshore sites with water 25-40 m deep have more energy because waves have less energy as the depth of the ocean decreases toward the coast. Losses become significant as the depth becomes less than half a wavelength, and at 20 m deep, the wave energy is around one-third of that in deep water (depth greater than one-half wave length). The North Atlantic west of Ireland has wavelengths of around 180 m, and off the West Coast of the United States, the wavelengths can be 300 m.
====
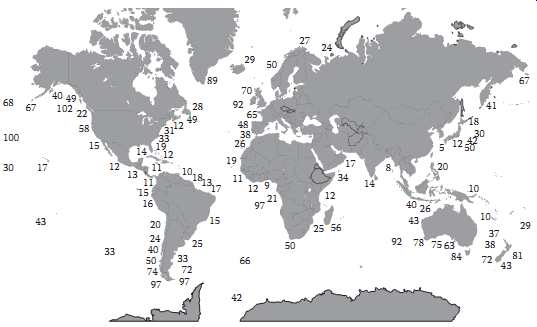
Above: Fig. 18 Average wave energy (kW/m) for coastlines around the world;
values are for deep-water sites.
====
The potential for wave energy (per meter of wave front) for the world is much larger than ocean currents due to the length of coastline ( Fig.18). The potential for the United States is 240 GW, with an extractable energy of 2100 TWh/year based on average wave power density of 10 kW/m. The technically and economically recoverable resource for the United Kingdom has been estimated to be 50-90 TWh of electricity per year or 15%-25% of total U.K. demand in 2010. The western coast of Europe and the Pacific coastlines of South America, Southern Africa, Australia, and New Zealand are also highly energetic. Any area with yearly averages of 15 kW/m has the potential to generate wave energy. Note that this threshold excludes areas such as the Mediterranean Sea and the Great Lakes of North America.
The resource or wave climate can be obtained from recorded data, and satellites now provide current worldwide data and are used for prediction of wave heights. For wave energy systems, it’s also important to determine the statistical occurrence of the extreme waves that can be expected at the site over the lifetime of the system since the system should be designed to survive peak waves.
Once the general area of the wave farm site has been determined, more analysis is needed to pick the best site within that area, for example, by examining the mean wave direction, variability, and the possibility of local focusing of waves. Another essential task includes the calculation of calm periods that allow sufficient time for maintenance and other operations. However, as noted, large waves have lots of power and could damage or destroy the system, so design and construction must take these large waves into account.
The mechanisms for capture of wave energy are point absorber, reservoir, attenuator, oscillating water column, and other mechanisms. There are a number of prototypes and demonstration projects but few commercial projects. A point absorber has a small dimension in relation to the wavelength ( Fig.19).
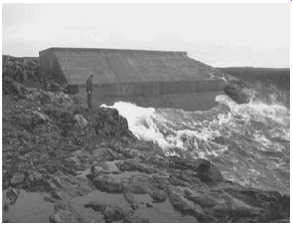
The reservoir system is where the waves are forced to higher heights by channels or ramps, and the water is captured in a reservoir ( Fig.20). Locations for land installations for reservoir and oscillating water column systems will be much more limited than offshore systems; however, land installations are easier to construct and maintain. The Wave Dragon is a floating offshore platform ( Figures 21 and 22).
The Pelamis Wave Energy Converter, an attenuator, is a semi-submerged, articulated cylindrical attenuator linked by hinged joints ( Fig.23). The wave-induced motion of these joints drives hydraulic rams, which pump high-pressure fluid through hydraulic motors via smoothing accumulators. The hydraulic motors drive an electrical generator, and the power from all the joints is fed down a single cable to a junction on the seabed. Several devices (Fig.24) can then be linked to shore through a single seabed cable. Current production machines have four power conversion modules: 750-kW rated power, 180 m long, 4-m diameter. The power table and the wave climate are combined to give the electrical power response over time and, from that, its average level and its variability. Depending on the wave resource, the capacity factor is 25%-40%.
===
Above: Fig. 19 PowerBuoy prototype, 40 kW, 14.6 m long, 3.5 m diameter; floats
4.25 m above surface of water.
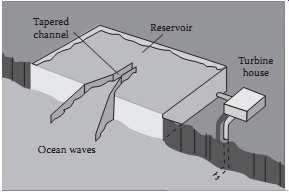
Above: Fig. 20 Diagram of a reservoir system on land. Reservoir Tapered channel
Turbine house Ocean waves
==
Above: Fig. 23 Sea trial of Pelamis Wave Energy Converter, 750 kW. (--Pelamis
Wave Energy.) Reservoir Overtopping Turbine outlet
===
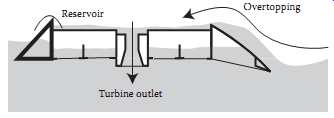
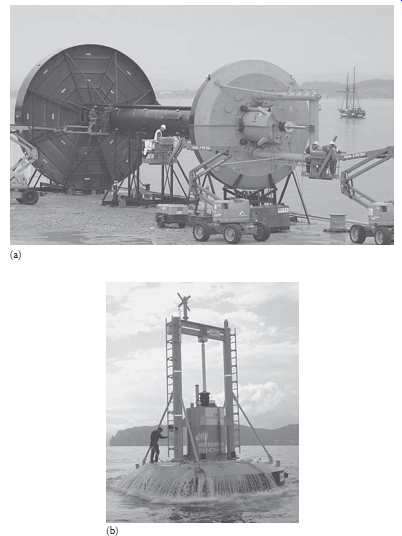
Above: Fig. 21 Diagram of floating reservoir system. (Diagram from Wave Dragon,
Ottawa, Ontario, Canada, http://www.wavedragon.net.)
===
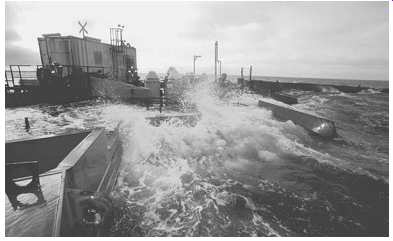
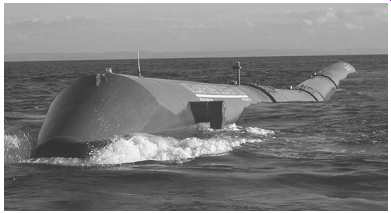
Above: Fig. 22 Prototype floating reservoir system, Nissum Bredning, Denmark.
(--Wave Dragon, Ottawa, Ontario, Canada, http://www.wavedragon.net.)
===
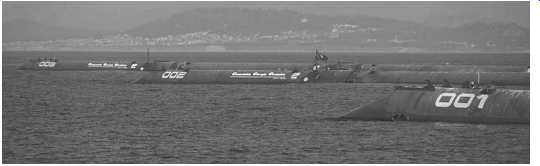
Above: Fig. 24 Installation of three units at Aguçadoura, Portugal, 2.25
MW total power. (Pelamis Wave Energy.) Wells turbine
===

Above: Fig. 25 Diagram of oscillating water column system.
===
Above: Fig. 26 LIMPET on Islay Island, Scotland, 500 kW; installed 2000.
(Voith Hydro Wavgen, Inverness-Shire, U.K.)
===
Above: Fig. 27 Oyster hydroelectric wave energy converter, 315 kW; unit installed
at Billa Croo, Orkney, Scotland. (Acquamarine Power, Edinburgh, U.K.)
===
In an oscillating water column, as a wave enters the column, the air pressure within the column is increased, and as the wave retreats, air pressure is reduced ( Fig.25). The Wells turbine turns in the same direction irrespective of the airflow direction. The land-installed marine power energy transmitter (LIMPET) unit on Isle of Islay, Scotland, has an inclined oscillating water column, with an inlet width of 21 m ( Fig.26) with the mean water depth at the entrance at 6 m. The system (rated power is 500 kW) has three water columns contained within concrete tubes, 6 m by 6 m, inclined at 40° to the horizontal, giving a total water surface area of 169 m^2. The upper parts of the tubes are connected to a single tube, which contains a Wells generator.
The design of the air chamber is important to maximize the conversion of wave energy to pneumatic power, and the turbines need to be matched to the air chamber. The performance has been optimized for annual average wave intensities of between 15 and 25 kW/m.
7.3 Ocean Thermal Energy Conversion
OTEC for producing electricity is the same as solar ponds, for which the thermal difference between surface water and deep water drives a Rankine cycle. There is one major difference: The deep ocean water is rich in nutrients, which can be used for mariculture. In both systems, there is the production of freshwater.
===
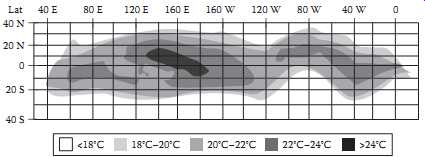
Above: Fig. 28 Ocean thermal differences, surface to depth of 1000 m. (NREL,
Golden, CO.)
===
An OTEC system needs a temperature difference of 20°C from cold water within 1000 m of the surface, which occurs across vast areas of the world ( Fig.28). The systems can be on or near the shore.
The three general types of OTEC processes are closed cycle, open cycle, and hybrid cycle.
In the closed-cycle system, heat transferred from the warm surface seawater causes a working fluid to turn to vapor, and the expanding vapor drives a turbine attached to an electric generator. Cold seawater passing through a condenser containing the vaporized working fluid turns the vapor back into a liquid, which is then recycled through the system.
An open-cycle system uses the warm surface water itself as the working fluid. The water vaporizes in a near vacuum at surface water temperatures. The expanding vapor drives a low-pressure turbine attached to an electrical generator. The vapor, which is almost pure freshwater, is condensed into a liquid by exposure to cold temperatures from deep ocean water. If the condenser keeps the vapor from direct contact with seawater, the water can be used for drinking water, irrigation, or aquaculture. A direct contact condenser produces more electricity, but the vapor is mixed with cold seawater, and the mixture is discharged to the ocean. Hybrid systems use parts of both open- and closed-cycle systems to optimize production of electricity and freshwater.
The first prototype OTEC project (22 kW) was installed at Matanzas Bay, Cuba, in 1930. Then, in the latter part of the twentieth century, experimental systems were installed in Hawaii and Japan.
An experimental, open-cycle, onshore system was operated intermittently between 1992 and 1998 at the Keahole Point Facility, National Energy Laboratory, Hawaii. Surface water is 26°C, and the deep water temperature is 6°C (depth of 823 m); the system produced a maximum power of 250 kW. However, the power requirements for pumping the surface (36.3 m^3 /min) and deep (24.6 m^3 min) seawater were around 200 kW. A small fraction (10%) of the steam produced was diverted to a surface condenser for the production of freshwater, about 22 L/min. In 1981, Japan demonstrated a shore-based, 100-kWe closed-cycle plant in the Republic of Nauru in the Pacific Ocean. The cold-water pipe was laid on the seabed at a depth of 580 m. The plant produced 31.5 kWe of net power during continuous operating tests.
7.4 Salinity Gradient
Salinity gradient energy is derived from the difference in the salt concentration between seawater and river water. Two practical methods for this are reverse electrodialysis and pressure-retarded osmosis; both rely on osmosis with ion-specific membranes. A small prototype (4 kW) started operation in 2009 in Tofte, Norway. The pressure generated is equal to a water column of 120 m, which is used to drive a turbine to generate electricity.
8 Other
Another application for water flow is ram pumps, where the pressure from water over a drop of a few meters is used to lift a small percentage of that water through a much greater height for water for people or irrigation. Ram pumps were developed over 200 year ago and can be made locally. The operation of a ram pump ( Fig.29) is as follows:
1. Water from a stream flows down the drive pipe and out of the waste valve.
2. As the flow of water accelerates, the waste valve is forced shut, causing a pressure surge (or water hammer) as the moving water is brought to a halt.
===
Air chamber; Delivery pipe; Drive pipe Check valve; Waste water flow; Waste valve
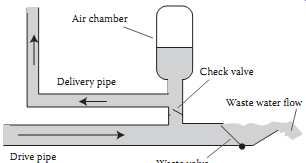
Above: Fig. 29 Diagram of ram pump.
===
3. The pressure surge causes the check valve to open, allowing high-pressure water to enter the air chamber and delivery pipe. The pressurized air in the air chamber helps to smooth out the pres sure surges to give a continuous flow through the delivery pipe.
4. As the pressure surge subsides, the pressurized air in the air chamber causes the check valve to close. The sudden closure of the check valve reduces the pressure in the drive pipe so that the waste valve opens, and the pump is returned to start the cycle again. Most ram pumps operate at 30-100 cycles a minute.
The Alternative Indigenous Development Foundation in the Philippines developed durable ram pumps, and the maintenance is done locally on the moving parts that need regular replacement. The five different size ram pumps can deliver between 1,500 and 72,000 L/day up to a height of 200 m. The 98 ram pumps installed by 2007 were delivering over 900 m^3/day of water, serving over 15,000 people and irrigating large areas of land.
Recommended Resources
Links
Acaua Marine Power, Ocean Power Technologies. Bonneville Power Administration. 2008. Renewable energy technology roadmap (wind, ocean wave, in stream tidal and solar).
EPRI tidal in-stream energy conversion (TISEC) project
European Ocean Energy Association.
http://www.eu-oea.com
Hydropower Research Foundation
International Energy Agency, Ocean Energy Systems. http://www.iea-oceans.org
International Hydropower Association. http://www.hydropower.org .
International Network on Small Hydro Power. http://www.inshp.org/main.asp
International Small-Hydro Atlas. http://www.small-hydro.com
Microhydro Power. Links to case studies
National Hydropower Association. http://www.hydro.org
Oceanweather, current significant wave height and direction by regions of the world. http://www.ocean weather.com/data .
United States, Water Power Technology Program
Wavebob. http://www.wavebob.com
Wave Dragon. http://www.wavedragon.net