AMAZON multi-meters discounts AMAZON oscilloscope discounts
4. Turbines: Impulse Turbines • Reaction Turbines
7. Ocean: Currents • Waves • Ocean Thermal Energy Conversion • Salinity Gradient
= = = = = = = =
1. Introduction
Energy from water is one of the oldest sources of energy, as paddle wheels were used to rotate a mill stone to grind grain. A large number of watermills, 200-500 W, for grinding grain are still in use in remote mountains and hilly regions in the developing world. There are an estimated 500,000 in the Himalayas, with around 200,000 in India. Of the 25,000-30,000 watermills in Nepal, 2,767 mills were upgraded between 2003 and 2007. Paddle wheels and buckets powered by moving water were and are still used in some parts of the world for lifting water for irrigation. Water provided mechanical power for the textile and industrial mills of the 1800s as small dams were built, and mill buildings are found along the edges of rivers throughout the United States and Europe. Then, starting in the late 1800s, water stored behind dams was used for the generation of electricity. For example, in Switzerland in the 1920s there were nearly 7000 small-scale hydropower plants.
The energy in water can be potential energy from a height difference, which is what most people think of in terms of hydro; the most common example is the generation of electricity (hydroelectric) from water stored in dams. However, there is also kinetic energy due to water flow in rivers and ocean currents. Finally, there is energy due to tides, which is due to gravitational attraction of the moon and the sun, and energy from waves, which is due to wind. In the final analysis, water energy is just another transformation from solar energy, except for tides.
The energy or work is force * distance, so potential energy due to gravitation is:
W F d m g H = = * * * J
The force due to gravity is mass * acceleration, where the acceleration of gravity g = 9.8 m/s^2 and H = height in meters of the water. For estimations, you may use g = 10 m/s^2.
For water, generally what is used is the volume, so the mass is obtained from density and volume.
m V m or * where kg/m for water 3 V, 1000
Then, for water Equation 1 becomes
PE g H V H V = = ?* * * * * 10 000,
Efficiencies from input to output (generally electric) range from 0.5 to 0.85. Small water turbines have efficiencies up to 80%, so when other losses are included (friction and generator), the overall efficiency is approximately 50%. Maximum efficiency is at the rated design flow and load, which is not always possible as the river flow fluctuates throughout the year or where daily load patterns vary.
The output from the turbine shaft can be used directly as mechanical power, or the turbine can be connected to an electric generator. For many rural industrial applications, shaft power is suitable for grinding grain or oil extraction, sawing wood, small-scale mining equipment, and so on.
2. World Resource
Around one-quarter of the solar energy incident on the Earth goes to the evaporation of water; however, as this water vapor condenses, most of the energy goes into the atmosphere as heat. Only 0.06% is rain and snow, and that power and energy of the water flow is the world resource, estimated at around 40,000 TWh/year. The technical potential (Table 1) is 15,000 TWh/year, and economic and environmental considerations reduce that potential.
--------
TABLE 1 Technical Potential, Hydroelectric Production, and Capacity
Potential, TWh/year | Production, TWh/year | Capacity, GW
[ Asia 5,090 Asia and Oceanic 798 257 Central and South America 2,790 660 136 Europe 2,710 536 166 Eurasia 245 68 Middle East 22 9 Africa 1,890 97 22 North America 1,670 665 164 Oceania 230 World 14,380 3000 822
Note: Production and capacity data for 2007 or 2008 from U.S. Energy Information Administration.]
----------
The classification of hydropower differs by country, authors, and even over time. One classification is large (>30 MW), small (100-30 MW), and micro (=100 kW). Some examples are as follows: In China, small hydro refers to capacities up to 25 MW, in India up to 15 MW, and in Sweden up to 1.5 MW. Now, in Europe, small hydro means a capacity of up to 10 MW. Today in China, the classifications are large (>30 MW), small (5-30 MW), mini (100 kW to 5 MW), micro (5-100 kW), and pico (<5 kW). Others classify microhydro as 10-100 kW, so be sure to note the range when data are given for capacity and energy for hydropower.
3. Hydroelectric
3.1 Large (=30 MW)
In terms of renewable energy, large-scale hydropower ( Fig.1) is a major contributor to electric generation in the world, over 3000 TWh/year. The world installed capacity for large-scale hydroelectricity has increased around 2% per year, from 462 GW in 1980 to around 850 GW in 2009. However, the hydroelectric percentage of electric power has decreased from 21.5% in 1980 to 16% in 2008 as other sources of electrical energy have increased faster. China is now the leader in installed capacity and generation of electricity ( Fig.2), with about 14% of their electricity from hydroelectric sources.
However, coal in China is the major energy source for the production of electricity, and more coal power has been added than hydroelectric power. In Norway, 98% of the electrical energy is from hydro; Paraguay sells most of its share of electricity from the Itaipu Dam to Argentina. In the United States, the hydroelectric contribution is around 6%. The contribution from small or micro-hydro plants is difficult to estimate but could represent another 5%-10% in terms of world capacity. The capacity factor for hydroelectric power in the world has been fairly consistent at 40%-44% from 1980 to 2008. The capacity factor for hydroelectric power in the United States was 37% in 2008.
===
Powerhouse, Generator, Turbine, Penstock, River, Intake
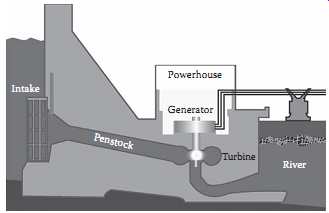
Above: Fig. 1 Diagram of hydroelectric plant. Height of water is level at
dam to turbine generator. ( Tennessee Valley Authority, Knoxville, TN.)
===
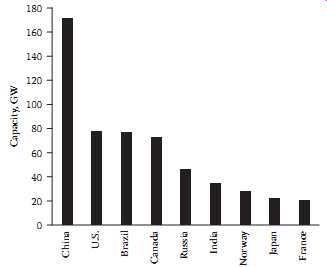
Above: Fig. 2 Installed hydroelectric capacity, 2009, top 10 countries.
===
TABLE 2 Large Hydroelectric Plants in the World, Date Completed, and Capacity
Country Dam Year Capacity, MW China Three Gorges 2011 22,500 Brazil-Paraguay Itaipu 1991 14,700 Venezuela Guri 1986 10,055 Brazil Tucurni 1984 8,370 United States Grand Coulee 1941 6,809 Russia Sayanao-Shushenskaya 1989 6,500 China Longtan 2009 6,300 Russia Krasnoyarsk 1972 6,000 Canada Robert-Bourassa 1981 5,616 Canada Churchill Falls 1971 5,429 United States Hoover 1936 2,079 For photos, see Google images.
====
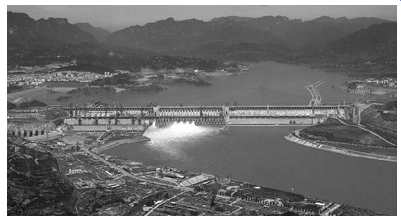
Above: Fig. 3 Three Gorges Dam, 22.5 GW, on the Yangtze River, China. (HydroChina,
Beijing, China.)
===
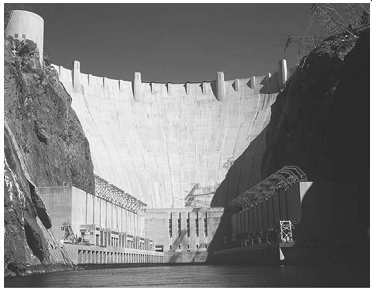
Above: Fig. 4 Hoover Dam, 2 GW, on the Colorado River, United States. (From
U.S. Bureau of Reclamation, Washington, DC.)
===
Above: Fig. 5 Grand Coulee Dam, 6.8 GW, on the Colombia River. ( U.S. Bureau
of Reclamation, Washington, DC.)
===
The benefits or advantages of hydropower are as follows:
1. Renewable source, power on demand with reservoirs
2. Long life, 100 years
3. Flood control, water for irrigation and metropolitan areas
4. Low greenhouse gas emission
5. Reservoir for fishing, recreation
Some disadvantages or problems are the following:
1. There is a large initial cost and long construction time.
2. Displacement of population due to reservoir may occur. For example, 1.24 million people were relocated due to the Three Georges Dam.
3. On land downstream, there is loss of nutrients from floods.
4. Drought by season or year may restrict power output due to low water.
5. Lack of passage for fish to spawning areas, For example, salmon.
6. Rivers with high silt content may limit dam life.
7. Dam collapse means many problems downstream. There have been over 200 dam failures in the twentieth century, and it’s estimated that 250,000 people died in a series of hydroelectric dam failures in China in 1975.
8. Resource allocation between countries can be a problem, especially if a series of dams that use a lot of water for irrigation are built upstream of a country.
In the United States, the first commercial hydroelectric plant (12.5 kW) was built in 1882 on the Fox River in Appleton, Wisconsin. Then, commercial power companies began to install a large number of small hydroelectric plants in mountainous regions near metropolitan areas. The creation of the Federal Power Commission in 1920 increased development of hydroelectric power with regulation and monetary support. The government supported projects for hydroelectric power and for flood control, navigation, and irrigation. The Tennessee Valley Authority was created in 1933, and the Bonneville Power Administration was created in 1937. Construction of the Hoover Dam ( Fig.4) started in 1931, and when completed in 1936, it was the largest hydroelectric project in the world at 2 GW.
Large-scale hydroelectric plants have been constructed all across the world (Table 2). The Three Gorges Dam ( Fig.3) on the Yangtze River is the largest power hydro plant in the world with 18.3 GW and will have a power of 22.5 GW when the rest of the generators are installed in 2011. Previously, the largest project was the Itaipu Dam on the Paraná River between Paraguay and Brazil. The series of dams is 7744 m long and was built from 1975 to 1991. The Aswan High Dam, Egypt (2100 MW), was completed in 1967 and produces more than 10 TWh/year, provides irrigation water for 3.2 million ha, and produces 20,000 ton of fish per year. The entire Temple of Abu Simel had to be moved to higher ground, a major feat in archeology. One of the problems of the Aswan Dam was that farming practices on the banks of the river downstream had to be changed since no yearly floods meant no deposition of fertile silt.
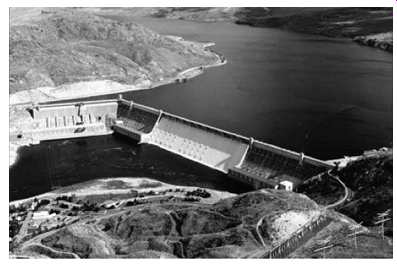
Hoover Dam was then surpassed in 1941 by the Grand Coulee Dam ( Fig.5) (6.8 GW) on the Columbia River. The larger power output is due to the higher volume of water available.
A geographic information system (GIS) application, the Virtual Hydropower Prospector, provides maps and information for the United States. The application allows the user to view the plants in the context of hydrography, power and transportation infrastructure, cities and populated areas, and federal land use. Most of the possible sites will be for small hydro.
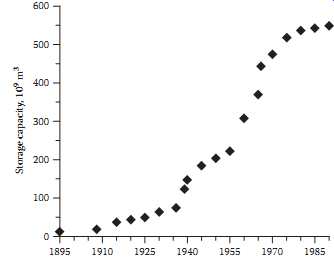
In the developed countries with significant hydroelectric capacity, many of the best sites for hydro electric potential already have dams. Many more reservoirs have been built for irrigation, water supply, and flood control than for hydropower as only 3% of the 78,000 dams in the United States have hydro power. Also, the construction of dams has declined in the United States since 1980 ( Fig.6). So, there is a potential for hydropower by repowering some defunct hydroelectric installations or by new installations of small or medium hydropower at existing dams.
Above: Fig. 6 Reservoir capacity in the United States. (Data from U.S. Geological
Survey, Reston, VA.)
===
3.2 Small Hydro (100 kW to 30 MW, 10 MW in Europe)
The definition of small hydro differs by country, so the range in Europe is 100 kW to 10 MW and in other countries is up to 25 or 30 MW. The World Energy Council estimated small hydro (up to 10 MW) was around 25,500 MW in 2006, with the major capacity in Europe, nearly 17,000 MW, and the energy production was estimated at 66 TWh. Now, the World Energy Council estimates the installed capacity of small hydro was around 55 GW in 2010, with China having the largest capacity. The current small hydro electricity generation in Europe (European Union-25, the candidate countries, and Switzerland) is around 47 TWh/year, and the remaining potential is estimated at another 49 TWh/year. This potential consists mainly of low-head sites (below 30 m).
===
Small hydro; Low power, conventional; Low power, unconventional; Microhydro; Existing hydroelectric plants; Excluded area; Wild and scenic river; Elevation key (feet) 7,400 0 0 125 250 500 miles 14,500 United States Legend
Above: Fig. 7 Present hydropower plans and possible sites for small and low
hydropower in the United States. ( Idaho National Laboratory, Idaho Falls,
ID.)
===
Hydroelectric plants in the United States are predominantly private (69%); however, 75% of the capacity is owned by federal and nonfederal public owners, primarily from large power plants. The percentage of low and small hydropower plants in terms of numbers is 86%. This indicates future expansion for hydroelectric power in the United States will be from distributed generation.
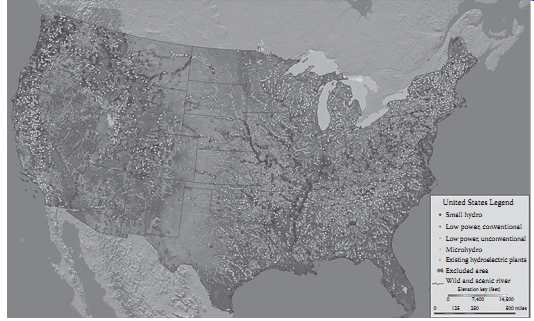
A resource assessment of hydropower for 49 states (no resource in Delaware) identified 5667 sites ( Fig.7) with a potential of around 30,000 MW. The criteria were low power (<1 MW) or small hydro (=1 MW and =30 MW), and the working flow was restricted to half the stream flow rate at the site or sufficient flow to produce 30 MWa (megawatts average), whichever was less. Penstock lengths were limited by the lengths of penstocks of a majority of existing low-power or small hydroelectric plants in the region. The optimum penstock length and location on the stream was determined for the maxi mum hydraulic head with the minimum length. The number of sites studied was 500,000, with approximately 130,000 sites meeting the feasibility criteria. Then, application of the development model with the limits on working flow and penstock length resulted in a total hydropower potential of 30,000 MWa.
The approximately 5,400 sites that could potentially be developed as small hydro plants have a total hydropower potential of 18,000 MWa. Idaho National Lab also developed a probability factor model, Hydropower Evaluation Software, to standardize the environmental assessment.
3.3 Microhydro (<100 kW)
Estimation of the number of installations and capacity for microhydro is even more difficult. In general, microhydro does not need dams and a reservoir as water is diverted and then conducted in a penstock to a lower elevation and the water turbine. In most cases, the end production is the generation of electricity.
There are thought to be tens of thousands of microhydro plants in China and significant numbers in Nepal, Sri Lanka, Pakistan, Vietnam, and Peru. The estimate for China was about 500 MW at the end of 2008. China started a program, SDDX, in 2003 that installed 146 hydro systems with a capacity of 113.8 MW in remote villages in the Western Provinces and Tibet. Hydropower was the predominant system in terms of capacity compared to wind and photovoltaics (PV), with 721 installations (15.5 MW) for villages and 15,458 installations (1.1 MW) for single households. The average size of the hydropower systems was 780 kW, which is much larger than average for the wind and PV systems (22 kW). Case studies are available for a number of countries, and software is available from Microhydro.
The advantages of microhydro are the following:
1. Efficient energy source. A small amount of flow (0.5 L/min) with a head of 1 m generates electricity with micro hydro. Electricity can be delivered up to 1.5 km.
2. Reliable. Hydro produces a continuous supply of electrical energy in comparison to other small scale renewable technologies. Also, backup, whether diesel or batteries (which causes operation and maintenance and cost problems), is not needed.
3. No reservoir required. The water passing through the generator is directed back into the stream with relatively little impact on the surrounding ecology.
4. It’s a cost-effective energy solution for remote locations.
5. Power for developing countries. Besides providing power, developing countries can manufacture and implement the technology.
The disadvantages or problems are as follows:
1. Suitable site characteristics are required, including distance from the power source to the load and stream size (flow rate, output, and head).
2. Energy expansion may not be possible.
3. There is low power in the summer months. In many locations, stream size will fluctuate seasonally.
4. Environmental impact is minimal; however, environmental effects must be considered before construction begins.
Impulse turbines are generally more suitable for microhydro applications compared with reaction tur bines because of:
- Greater tolerance of sand and other particles in the water
- Better access to working parts
- Lack of pressure seals around the shaft
- Ease of fabrication and maintenance
- Better part-flow efficiency
The major disadvantage of impulse turbines is that they are generally unsuitable for low-head sites.
Pelton turbines can be used at heads down to about 10 m; however, they are not used at lower heads because their rotational speeds are too slow, and the runner required is too large. The cross-flow turbine is the best machine for construction by a user.
4. Turbines
The two main types of hydro turbines are impulse and reaction. The type selected is based on the head and the flow, or volume of water, at the site (Table 3). Other deciding factors include how deep the turbine must be set, efficiency, and cost. Many images are available on the Internet for the different types of turbines.
4.1 Impulse Turbines
The impulse turbine uses the velocity of the water to move the runner (rotating part) and discharges to atmospheric pressure. The water stream hits each bucket on the runner, and the water flows out the bottom of the turbine housing. An impulse turbine is generally used for high-head, low-flow applications.
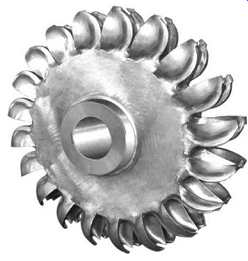
A Pelton turbine (Fig.8) has one or more free jets of water impinging on the buckets of a runner.
The jet is directed at the centerline of the two buckets. Draft tubes are not required for the impulse turbine since the runner must be located above the maximum tail water to permit operation at atmospheric pressure.
A cross-flow turbine ( Fig.9) resembles a squirrel cage blower and uses an elongated, rectangular section nozzle to direct a sheet of water to a limited portion of the runner, about midway on one side.
The flow of water crosses through the empty center of the turbine and exits just below the center on the opposite side. A guide vane at the entrance to the turbine directs the flow to a limited portion of the runner. The cross flow was developed to accommodate larger water flows and lower heads than the Pelton turbine.
===
TABLE 3 Classification of Turbine Type
- Head Pressure
- Turbine High Medium Low
- Impulse Pelton Cross flow Cross flow
- Turgo Turgo
- Multijet pelton Multijet pelton
- Reaction Francis Propeller
- Kaplan
===
Above: Fig. 8 Pelton runner (cast) showing bucket shape.
===
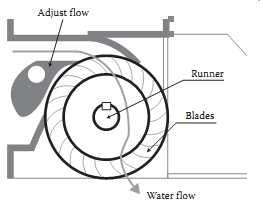
Above: Fig. 9 Diagram of cross-flow turbine. Runner Blades Water flow Adjust
flow
===
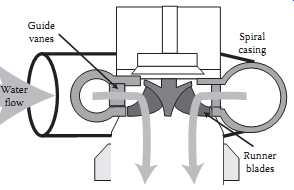
Above: Fig. 10 Diagram of Francis turbine. Runner blades; Guide vanes; Spiral
casing; Water flow
===
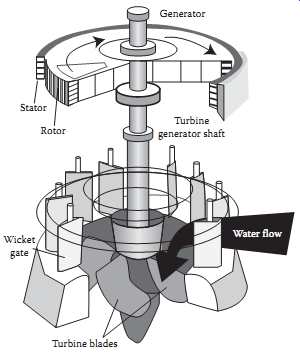
Above: Fig. 11 Diagram of propeller turbine. Generator, Stator, Rotor, Turbine
generator shaft, Turbine blades, Water flow, Wicket gate
===
4.2 Reaction Turbines
A reaction turbine develops power from the combined action of pressure and moving water, as the pres sure drop across the runner produces power. The runner is in the water stream flowing over the blades rather than striking each individually. Reaction turbines are generally used for sites with lower head and higher flows.
Francis turbines ( Fig.10) are the most common for hydropower. They are an inward flow turbine that combines radial and axial components. The runner has fixed vanes, usually nine or more. The inlet is spiral shaped with guide vanes to direct the water tangentially to the runner. The guide vanes (or wicket gate) may be adjustable to allow efficient turbine operation for a range of water flow conditions.
The other major components are the scroll case, wicket gates, and draft tube (as water speed is reduced, a larger area for the outflow is needed). However, the Francis turbine can be used for heads to 800 m.
A propeller turbine ( Fig.11) generally has a runner with three to six blades running in a pipe, where the pressure is constant. The pitch of the blades may be fixed or adjustable. The major components besides the runner are a scroll case, wicket gates, and a draft tube.
There are several different types of propeller turbines:
Bulb: The turbine and generator are a sealed unit placed directly in the water stream.
Straflo: The generator is attached directly to the perimeter of the turbine.
Tube: The penstock bends just before or after the runner, allowing a straight-line connection to the generator.
Kaplan: Both the blades and the wicket gates are adjustable, allowing for a wider range of operation.