AMAZON multi-meters discounts AMAZON oscilloscope discounts
.
- 1 Wind Resource: Wind Shear • Wind Maps • Wind Turbines
- 2 Wind Farms: Small Wind Turbines • Village Power • Wind Diesel • Other • Performance
- 3 Institutional Issues
- 4 Economics
- 5 Summary
- References/Links
Before the industrial revolution, wind was a major source of power for pumping water, grinding grain, and long-distance transportation (sailing ships). Farm windmills for pumping water are still being manufactured and used around the world, with the peak use in the United States in the 1930s and 1940s when there were over 6 million.
During the 1930s, small wind systems (100 W to 1 kW) with battery storage were installed in rural areas; however, these units were displaced with power from the electric grid through rural electric cooperatives. There were a number of attempts to build wind turbines for the utility grid; however, most operated only a short time due to technical and economic problems. The only exception was the Gedser turbine (35 m diameter, 200 kW) in Denmark, which operated from 1958 to 1967.
After the first oil crisis in 1973, there was a resurgence interest in small systems, with the sale of refurbished units and manufacturer of new units. Also as a response to the oil crisis, governments and utilities were interested in the development of large wind turbines as power plants for the grid. In the 1980s the market was driven by installation of distributed wind turbines in Denmark and the wind farm market in California, which led to today's significant wind industry.
The major advantages of wind energy are similar to most other renewable energy resources; renew able (nondepleting), ubiquitous (located in many regions of the world), and in addition wind energy and photovoltaics don’t require water for the generation of electricity. The disadvantages are that wind is variable and comes from a low-density source, which then translates into high initial costs. In general, windy areas are distant from load centers, which means that transmission is a problem for large-scale installation of wind farms.
The rapid growth of wind power ( TBL. 1) has been due to wind farms with 194,400 MW installed by the end of 2010 and in addition there are around 1,200 MW from other applications. There will be an overlap between large and small (=100 kW) wind turbines in the diverse applications of distributed and community wind, wind diesel, and village power (primarily hybrid systems). Wind turbines for producing electricity for stand-alone applications or grid connected for households and small businesses, telecommunications are primarily small wind turbines. Numbers installed and capacity are estimates with better data for wind farms and rougher estimates for the other applications.
As of 2010, over 70 countries have installed wind power as most countries are seeking renewable energy sources and have wind power as part of their national planning. Therefore, countries have wind resource maps and others are in the process of determining their wind power potential, which also includes offshore areas.
====
TBL. 1 Wind Energy Installed in the World, Estimated Numbers and Capacity, End of 2010 Application # Capacity, MW Wind turbines (primarily in wind farms) 161,000 194,400 Distributed a -community 1,300 400 Wind diesel 270 28 Village power 2,000 50 Small wind turbines 700,000 250-300 Telecommunication 500 2-5 Farm windmill 310,000 Equivalent, 155
The overlap between distributed wind turbines and wind farm installations is difficult to distinguish. For example in Denmark, the large number of distributed units is counted as part of national capacity.
====
1 Wind Resource
The primary difference between wind and solar power is that power in the wind increases as the cube of the wind speed,
P/A = 0 5 3 . p x v^3 ( ) ? W/m^2
The power/area is also referred to as wind power density. The air density depends on the temperature and barometric pressure, so wind power will decrease with elevation, around 10% per 1000 m. The aver age wind speed is only an indication of wind power potential and the use of the average wind speed will underestimate the actual wind power. A wind speed histogram or frequency distribution is needed to estimate the wind power/area. For siting of wind farms, data are needed at heights of 40-50 m and generally at hub heights. Since wind speeds vary by hour, day, season, and even years, 2-3 years of data are needed to have a decent estimate of the wind power potential at a specific site. Wind speed data for wind resource assessment are generally sampled at 1 Hz and averaged over 10 min (sometimes 1 h). From these wind speed histograms (bin width of 1 m) the wind power/area is determined.
1.1 Wind Shear
Wind shear is the change in wind speed with height and the wind speed at higher heights can be estimated from a known wind speed. Different formulas are available, but most use a power law:
where v is the estimated wind speed at height H v0 is the known wind speed at height H0 a is the wind shear exponent.
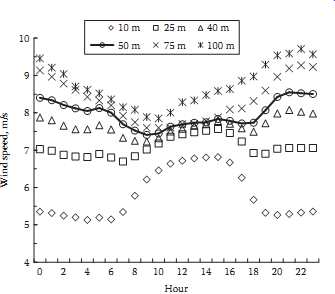
Above: Fig. 1 Average annual wind speed by time of day for White Deer, Texas
(10, 25, 40, 50 m), and Washburn, Texas (75, 100 m).
The wind shear exponent is determined from measurements and in the past, a value of 1/7 (0.14) was used for stable atmospheric conditions. Also this value meant that the power/area doubled from 10 to 50 m, a convenient value since the world meteorological standard for measurement of wind speed was 10 m height.
In many continental areas the wind shear exponent is larger than 0.14, and the wind shear also depends on the time of day with a change in the pattern from day to night at a height around 40 m ( Fig. 1). This means that wind farms will produce more energy at night when the load of the utility is lower, a problem for the value of the energy sold by the wind farm. The pattern of the data at 50 m for Washburn (not shown on graph) was similar to 50 m data at White Deer; however, there even was some difference between the two sites. Both sites were in the plains around 40 km apart. This shows that wind power is fairly site specific, even in the plains. Wind data for wind farms have to be taken at heights of at least 40-50 m, as at these heights and above the wind pattern will be same and the wind speeds at higher heights at the same site can be estimated using Eqn. 2. There are some locations, such as mountain passes, where there is little wind shear, so taller towers for wind turbines would not be needed. Note that with large MW wind turbines, hub heights are 60 m to over 120 m.
1.2 Wind Maps
Wind power maps, W/m^2 , are available for many countries, regions, and states/provinces within countries. Early maps were for 10 m height with an estimate for 50 m using the power law for wind shear Eqn. 2 and a wind shear exponent of 0.14. The wind power map for the United States ( Fig. 2) shows large areas with wind class 3 and above. More detailed state maps are available. In addition, wind power potential is estimated using geographic information systems (GIS) with land excluded due to urban areas, highways, lakes and rivers, wildlife refugees, and land that is at a distance from high volt age transmission lines. The wind power potential is very large, so it’s not a question of the wind energy resource, but a question of locations of good to excellent wind resource, national and state policies, economics, and amount of penetration of wind power into the grid. For example, the catchable wind power potential of Texas is estimated at 223,000 MW, which is much larger than the 110,000 MW generating capacity of the state.
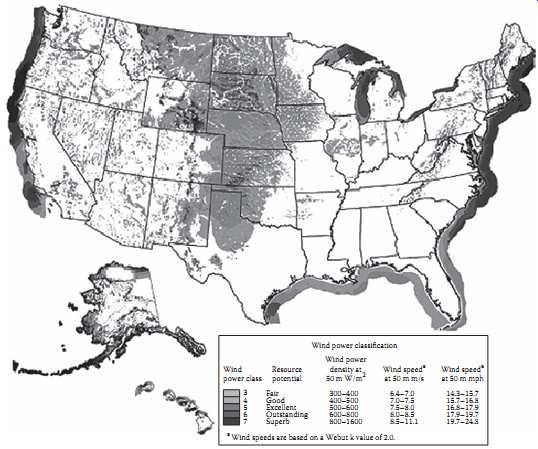
Above: Fig. 2 Wind power map at 50 m height for the United States. Notice
wind classes (Map from NREL).
Computer tools for modeling the wind resource have been developed by a number of groups, National Wind Technology Center, National Renewable Energy Laboratory (NREL), United States; RISO in Denmark (WAsP); other government labs, and private industry. WAsP has been employed in over 100 countries and territories around the world. Now revised wind power maps for (50, 80, and even 100 m height) are available, which use terrain, weather balloon data, and computer models, and the maps were also verified with available data at 50 m heights. These maps are a good screening tool for wind farm locations, and they show regions of higher-class winds in areas where none was thought to exist.
Also because of the larger wind shear than expected, more areas have suitable winds for wind farm development. Remember that 2%-7% accuracy in wind speeds means a 6%-21% error in estimating wind power, so data on site are still needed for locations of wind farms in most areas. Interactive wind speed maps by 3Tier and AWS-Truewind are available online for many locations in the world.
Wind Atlases of the World contains links for over 50 countries.
Complete coverage of the oceans is now available using reflected microwaves from satellites. Ocean wind speed and direction at 10 m are calculated from surface roughness measurements from the daily orbital observations mapped to a 0.25° grid, which are then averaged over 3 days, a week, and a month. Images of the data can be viewed on websites for the world, by region or selected area.
Ocean winds are not available within 25 km of the shore, as the radar reflections of the bottom of the ocean skew the data. Ocean winds will indicate onshore winds for islands, coasts, and also some inland regions of higher winds ( Fig. 3). There are now wind farms in the Isthmus of Tehuantepec, Mexico and the Arenal region of Costa Rica, where the northeast trade winds (average wind speeds of 10 m/s) are funneled by the land topography.
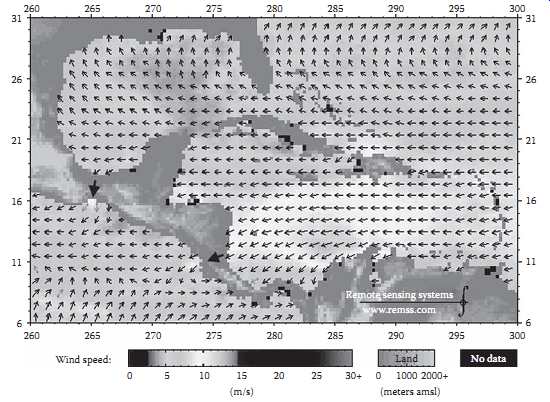
Above: Fig. 3 Ocean winds for July 2002. Two arrows on land indicate excellent
onshore wind regions. QuikScat wind vectors: 2002/2007-Monthly average-Gulf
of Mexico
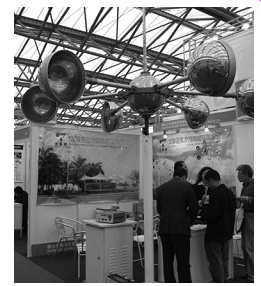
Above: Fig. 4 Drag device with cup blades, similar to anemometer. Vertical
axis wind turbine; Savonius; Giromill; Darrieus; Horizontal axis wind turbine
Magnus effect.
1.3 Wind Turbines
Wind turbines are classified according to the interaction of the blades with the wind, orientation of the rotor axis with respect to the ground and to the tower (upwind, downwind), and innovative or unusual types of machines. The interaction of the blades with the wind is by drag or lift or a combination of the two.
For a drag device, the wind pushes against the blade or sail forcing the rotor to turn on its axis, and drag devices are inherently limited in efficiency since the speed of the device or blades cannot be greater than the wind speed. The maximum theoretical efficiency is 15%. Another major problem is that drag devices have a lot of material in the blades. Although a number of different drag devices ( Fig. 4) have been built, there are essentially no commercial (economically viable) drag devices in production for the generation of electricity.
Most lift devices use airfoils for blades ( Fig. 5), similar to propellers or airplane wings; however, other concepts are Magnus (rotating cylinders) and Savonius wind turbines ( Fig. 6). A Savonius rotor is not strictly a drag device, but it has the same characteristic of large blade area to intercept area.
This means more material and problems with the force of the wind on the rotor at high wind speeds, even if the rotor is not turning. An advantage of the Savonius wind turbine is the ease of construction.
Using lift, the blades can move faster than the wind and are more efficient in terms of aerodynamics and use of material, a ratio of around 100 to 1 compared to a drag device. The tip speed ratio is the speed of the tip of the blade divided by the wind speed, and lift devices typically have tip speed ratios around seven. There have even been one-bladed wind turbines, which save on material; however, most modern wind turbines have two or three blades.
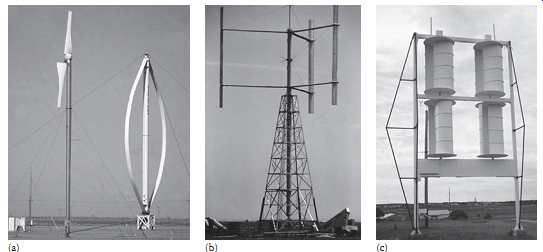
Above: Fig. 6 Examples of different wind turbines. (a) HAWT, diameter = 10
m, 25 kW; Darrieus, diameter = 17 m, 24 m tall rotor, 100 kW. (b) giromill,
rotor diameter = 18 m, 12.8 m height, 40 kW. (c) Savonius, 10 kW.
The power coefficient is the power out or power produced by the wind turbine divided by the power in the wind. From conservation of energy and momentum, the maximum theoretical efficiency of a rotor is 59%. The capacity factor is the average power divided by the rated power. The average power is generally calculated by knowing the energy production divided by the hours in that time period (usually a year or can be calculated for a month or a quarter). For example, if the annual energy production is 4500 MWh for a wind turbine rated at 1.5 MW, then the average power = energy/hours = 4500/8760 = 0.5 MW and the capacity factor would be 0.5 MW/1.5 MW = 0.33 = 33%. So the capacity factor is like an average efficiency. A power curve shows the power produced as a function of wind speed ( Fig. 7). Because there is a large scatter in the measured power versus wind speed, the method of bins (usually 1 m/s bid width suffices) is used.
===
Pitch Low-speed shaft Gear box Stator Rotor Controller Anemometer Vane Nacelle High speed shaft Generator Tower Yaw motor Yaw drive Brake Hub Wind direction Blade Rotor (blades, Hub)
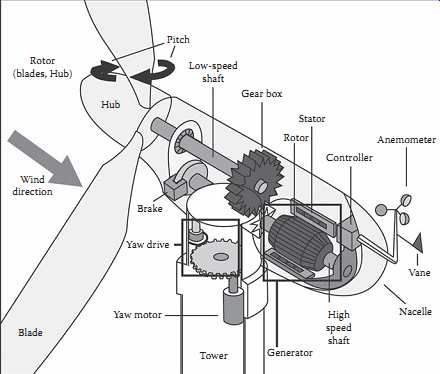
Above: Fig. 8 Diagram of main components of large wind turbine.
===
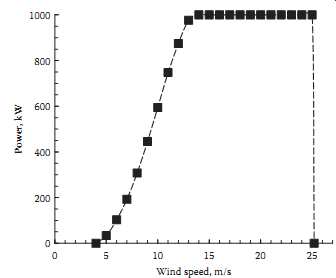
Above: Fig. 7 Power curve for a 1 MW wind turbine.
Wind turbines are further classified by the orientation of the rotor axis with respect to the ground: horizontal axis wind turbine (HAWT) and vertical axis wind turbine (VAWT). The rotors on HAWTs need to be kept perpendicular to the wind, and yaw is this rotation of the unit about the tower axis. For upwind units yaw is by a tail for small wind turbines-a motor on large wind turbines, and for down wind units-yaw may be by coning (passive yaw) or a motor.
VAWT have the advantage of accepting the wind from any direction. Two examples of VAWTs are the Darrieus and giromill. The Darrieus shape is similar to the curve of a moving jump rope; however, the Darrieus is not self-starting, as the blades should be moving faster than the wind to generate power. The giromill can have articulated blades which change angle so it can be self-starting. Another advantage of VAWTs is that the speed increaser and generator can be at ground level. A disadvantage is that taller towers are a problem for VAWTs, especially for wind farm size units. Today there are no commercial, large-scale VAWTs for wind farms, although there are a number of development projects and new companies for small VAWTs. Some companies claim they can scale to MW size for wind farms.
The total system consists of the wind turbine and the load, which is also called a wind energy conversion system (WECS). A typical large wind turbine consists of the rotor (blades and hub), speed increaser (gear box), conversion system, controls and the tower ( Fig. 8). The most common configuration for large wind turbines is three blades, full span pitch control (motors in hub), upwind with yaw motor, speed increaser (gear box), and doubly fed induction generator (allows wider range of rpm for better aerodynamic efficiency). The nacelle is the covering or enclosure of the speed increaser and generator.
The output of the wind turbine, rotational kinetic energy, can be converted to mechanical, electrical, or thermal energy. Generally it’s electrical energy. The generators can be synchronous or induction connected directly to the grid, or a variable frequency alternator (permanent magnet alternator) or direct current generator connected indirectly to the grid through an inverter. Most small wind turbines are direct drive and no speed increaser and operate at variable rpm. Wind turbines without a gearbox are direct drive units. Enercon has built large wind turbines with huge generators and no speed increaser, which have higher aerodynamic efficiency due to variable rpm operation of the rotor.
However, there are some energy losses in the conversion of variable frequency to the constant frequency (50 or 60 Hz) needed for the utility grid.
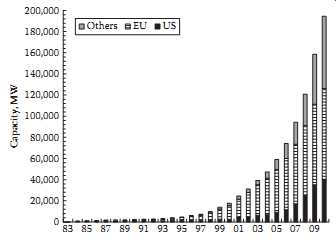
Above: Fig. 9 Wind power installed in the world, 2009, primarily wind farms.
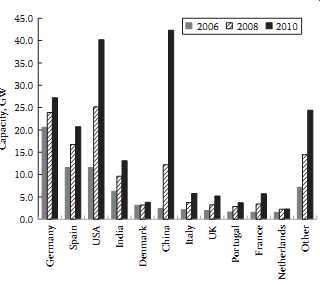
Above: Fig. 10 Cumulative wind power installed by country at the end of the
year, primarily wind farms. [0.0 Germany Spain USA India Denmark China Italy
UK Portugal France Netherlands Other]
1.2 Wind Farms
The development of wind farms began in the early 1980s in California with the installation of wind turbines ranging from 20 to 100 kW, as those were the only sizes available in the commercial market. This development of wind farms in California was due to U.S. federal laws and incentives (1980-1985) and due to the avoided costs for energy set by the California Public Utility Commission for electricity generated by those wind farms. As the wind farm market in the world continued, there was a steady progression toward larger size wind turbines due to economies of scale, and today there are commercial multi-megawatt units.
Since then other countries have supported wind energy and by the end of 2010 there were 194.4 GW installed ( Fig. 9) from around 160,000 wind turbines. At 35% capacity factor, the estimated energy production is around 6 * 10^8 GWh/year. Installation of wind turbines in Europe was led by Denmark in the early days and its manufacturers captured a major share of the world market in the 1980s. Then other European countries installed large numbers of wind turbines and Germany became the world leader. In addition, there was consolidation of manufacturers with both Germany and Spain becoming major players. Then in 2007-2008 the major wind farm installations shifted back to the United States and now in 2010 China is the leader in installed capacity ( Fig. 10) with the United States in second place. Although the United States had a large number of wind turbines installed and the electricity generated by wind was 7.3 * 10^7 MWh in 2009, wind energy accounted for only 1.3% of the total electricity generated. However, wind power accounted for 35% of new electric power generating capacity in the United States in 2009. Other countries obtain a larger share of their electric demand from wind and Denmark is the leader as 24% of their electricity comes from wind power. In Spain during the early morning on a spring day in 2010, over 50% of the electric demand was provided by wind power.
There are 2939 MW (end of 2010) installed in offshore wind farms in Europe, because of the high cost of land in Europe. Information on European key trends and statistics is available from the European Wind Energy Association and the Global Wind Energy Council. In China, the first 100 MW offshore wind farm was completed in 2010, and in addition, 600 MW offshore and 400 MW intertidal land wind power concession projects are under construction. Offshore wind farms are being planned for other parts of the world, for example, in the United States off the East Coast, Texas Gulf Coast, and in the Great Lakes.
The growth of installed capacity in the world has been 20%-30% per year starting in 2005, but with the present world economic recession, some countries did not experience a large growth rate in 2010.
Texas surpassed California in installed capacity in 2008 and with over 9700 MW installed by the end of 2010, Texas continues to lead the United States in installed capacity [13]. There have been a number of estimates for the future, one being a world wind installed capacity of 240 GW by 2020, which would be a 100% increase over 2008. However, that projection is now lower than other projections.
Market forecasts for wind power were seen as overly optimistic at the time of the prediction and then were exceeded every time by the actual amount of installations. World wind capacity grew by over 170% over the 5 years from 2005 through 2009. The Global Wind Energy Council forecast in 2009 was for 409 GW by the end of 2014 [14], an increase of 215 GW in the next 4 years.
My estimate is that the world wind capacity will be over 700 GW by 2020, an increase of over 500 GW over 2010. This estimate is due to the changes in national policies promoting wind power, primarily in the United States, China, and Europe. Also the estimate is based on continuing incentives for renew able energy, carbon trading, and the construction of high voltage transmission lines from windy areas to load centers. The new mandate for China is 200 GW of wind power by 2020, and Europe plans an additional 100 GW by 2020. Wind energy could produce 20% of U.S. electricity by 2030 [15], which would require an installed capacity of 300 GW. It’s assumed that the rest of the world will install at least 100 GW by the end of 2020. If solar energy, bioenergy, and geothermal energy were included, then renewable energy would provide an even larger percentage of U.S. demand for electricity. The prospects for the wind industry are excellent, and this does not count the increased numbers of distributed, com munity, and small wind turbines.
Wind turbines for wind farms increased in size from the 100 kW to megawatts due to economies of scale. There were two different tracks for the development of wind turbines for wind farms. The first was R&D plus demonstration projects of large wind turbines for utility power in the 1970s and 1980s, primarily funded by governments. Only prototypes were built and tested. The second track was wind turbines in the 50-100 kW size built by private manufacturers to meet the distributed market in Europe and for wind farms in California. The manufacturers of the second track were successful in developing the modern wind turbine industry, while the units developed primarily by aerospace companies did not make it to the commercial stage.
There were a number of different designs built and sold in the wind farm market in California, including Darrieus wind turbines. In the United States the most common designs were two blades, fixed pitch, rotor downwind, teetered hub, induction generator; and three blades, variable pitch, rotor downwind, induction generator of which U.S. wind power built over 4000 units (late 1980s) for the California wind farm market. In Europe the three blades, fixed pitch, upwind rotor were the predominate design. Now the three blades, rotor upwind, full span variable pitch, and a wider range of rpm are the major type for wind farms. Enercon has a wind turbine with large generator and no gearbox.
Today, wind turbines are available in megawatt sizes with rotor diameters of 60 to over 100 m and installed on towers of 60 to over 100 m. Manufacturers are designing and building wind turbines in the 5-10 MW size, primarily for offshore installations. Out of the top 15 manufacturers in 2007, 10 were from Europe, 2 from China, and 1 each from the United States, Japan, and India. Today other major international companies are buying existing manufacturers of wind turbines or starting manufacturing wind turbines for the wind farm market.
Vestas is the world's leading manufacturer with over 20% of the market and they have installed more than 43,000 wind turbines with a capacity greater than 44,000 MW (2010 data). As an example of a large wind turbine installation, a Vestas, V90, rated at 3 MW, 90 m diameter on 80 m tower is located north of Gruver, Texas ( Fig. 11). Twenty trucks were needed to haul an 800 metric ton crane to the site and another 10 trucks for the turbine and tower. The weight of the components were nacelle = 70 metric tons, rotor = 41 metric tons, and tower = 160 metric tons. The foundation required 460 m^3 of concrete and over 40 metric tons of rebar.
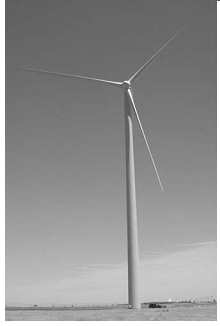
Above: Fig. 11 Vestas, V90, 3 MW wind turbine. Notice minivan next to the
tower.
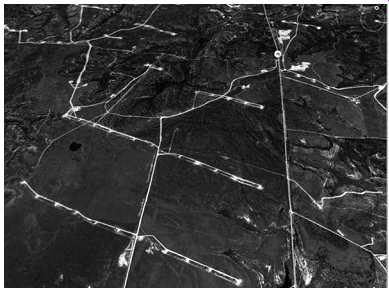
Above: Fig. 12 Satellite view of layout of part of the Sweetwater wind farm
(south of Sweetwater, Texas). Notice distance between rows is larger than distance
between wind turbines within a row. Rows are perpendicular to pre dominate
wind direction.
There are economies of scale for installation of wind turbines for wind farms, and in general, most projects need 30-50 MW to reach this level. The spacing for wind turbines is 3-4 rotor diameters within a row and 8-10 rotor diameters from row to row. On ridgelines and mesas there would be one to two rows with a 2-rotor diameter spacing within a row. In general for plains and rolling terrain, the installed capacity could be 5-10 MW per square kilometer and for ridgelines, 8-12 MW per linear kilometer.
Satellite images show the layout of wind farms ( Fig. 12); however, the maps may not show the latest installations. In Texas in 2010 there were five wind farms over 500 MW, and the largest was Roscoe at 782 MW.
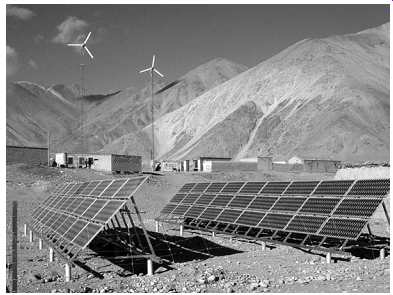
Above: Fig. 13 China village power system (PV/wind/diesel), 54 kW.
2.1 Small Wind Turbines
There are a number of different configurations and variations in design for small wind turbines (W to 100 kW). Many of the small wind turbines have a tail for both orientation and control in high winds.
There are around 700,000 small wind turbines in the world with a capacity around 250-300 MW; how ever, these are very rough estimates. China has produced around 350,000 small wind turbines, primarily from 50 to 200 W, stand-alone systems with battery storage. Now China is starting to build units in the 1-50 kW range. In the United States and Europe, approximately 25% of the small wind turbines are connected to the grid.
In 2010, there are around 100 manufacturers of small wind turbines with around 40 in Europe and 30 in China, and there is a resurgence of VAWTs designs. The United States is a leading producer of small wind turbines in the 1-50 kW range and the installed capacity of small wind in the United States is around 80 MW. The National Wind Technology Center, NREL has a development program for small wind turbines. Wind energy associations around the world generally have a small wind section and the American Wind Energy Association has Global Market Studies and a U.S. Roadmap. The Roadmap estimates that small wind could provide 3% of U.S. electrical demand by 2020.
2.2 Village Power
Village power is another large market for small wind turbines as approximately 1.6 billion people don’t have electricity and extension of the grid is too expensive in rural and remote areas with difficult terrain. There are around 2000 village power systems with an installed capacity of 55 MW. Village power systems are mini grids, which can range in size from small micro grids (<100 kWh/day, ~15 kW) to larger communities (tens of MWH/day, hundreds of kW). Today there is an emphasis on systems that use renewable energy (wind, PV, mini and micro hydro, bioenergy, and hybrid combinations). These systems need to supply reliable, however, limited amount of energy, and in general much of the cost has to be subsidized. The other components of the system are controllers, batteries, inverters, and possibly diesel or gas generators. In windy areas, wind turbines are the least-cost component of the renewable power supply and one or multiple wind turbines may be installed, 10-100 kW range.
China leads the world in installation of renewable village systems of which 100 include wind. Their Township Electrification Program in 2002 installed 721 village power systems with a capacity over 15 MW (systems installed; 689 PV, 57 wind/PV and 6 wind). An example is the village power system (54 kW) for Subashi, Zinjiang Province, China ( Fig. 13), which consisted of 20 kW wind, 4 kW PV, 30 kVA diesel, 1000 Ah battery bank, and a 38 kVA inverter. The installed cost was $178,000 for power and mini grid, which is reasonable for a remote site.
2.3 Wind Diesel
For remote communities and rural industry, the standard for electric generation is diesel power. Remote electric power is estimated at 12 GW, with 150,000 diesel generator sets ranging in size from 50 to 1000 kW. In many locations these systems are subsidized by regional and national governments.
Diesel generators have low installed costs; however, they are expensive to operate and maintain, especially in remote areas. Even with diesel generators, many small villages only have electricity in the evening. Costs for electricity were in the range from $0.20 to $0.50/kWh; however, as the cost of diesel increases, the cost per kWh increases.
Wind turbines can be installed at existing diesel power plants as a low (fuel saver, diesel does not shut down), medium, or high penetration (wind power supplies more of the load, which results in better economics as diesel engines may be shut down). The wind turbine(s) may be part of a retrofit, an integrated wind-diesel, or wind/PV/diesel hybrid systems for village power. Rough estimates indicate there are over 220 wind-diesel systems in the world, ranging in size from 100 kW to megawatts. Reports on operational experiences from 11 wind-diesel systems are available from the 2004 wind-diesel workshop.
At Kotzebue, Alaska, they have six diesel generators (11.2 MW, annual average load = 2.5 MW, peak load = 3.9 MW) and the large reserve capacity is to prevent any loss of load during the winter. The cost of electricity was around $0.50/kWh. Consumption of diesel fuel was around 5.3 million liters per year with an average conversion of 4 kWh/L. There are 17 wind turbines located on a flat windy plain 7 km south of town and 0.8 km from the coast. In 2007 the wind turbines generated 667,500 kWh for a savings of 172,000 L of diesel fuel.
The U.S. Air Force installed four, 225 kW wind turbines connected to two, 1900 kW diesel generators (average load 2.4 MW) on Ascension Island [19] for a low penetration system (14%-24%). Tower height was limited to 30 m due to available crane capacity on the island. In 2003, two additional wind turbines (900 kW each), along with a boiler and advanced controller, were installed and that brought the average wind penetration to 43%-64%. Fuel savings were approximately $1 million/year.
A number of wind turbine manufacturers have wind-diesel, hybrid, and even hydrogen production options. These range from simple, no storage systems to complex, integrated systems with battery storage and dump loads.
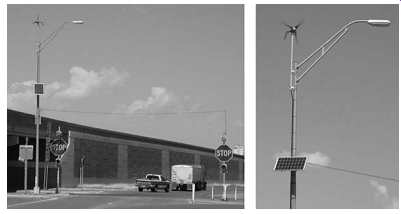
Above: Fig. 14 PV/wind powers streetlight and flashing red lights at stop
signs, McCormick Road on I 27 between Canyon and Amarillo, Texas.
2.4 Other
There is an overlap of small and large wind turbines installed for the wind-diesel and distributed markets. Distributed systems are the installation of wind turbines on the retail or consumer side of the electric meter for farms, ranches, agribusiness, small industries, and small-scale community wind for schools and other public entities. Examples are as follows:
One 660 kW wind turbine at the American Wind Power Center and Museum, Lubbock, Texas Ten 1 MW wind turbines at a cotton seed oil plant, Lubbock, Texas Three school districts in towns near Lubbock, Texas, have install a total of eight 50 kW units Four 1.5 MW wind turbines supply electricity for the City of Lamar, Colorado There were approximately 300 MW of community wind projects installed in the United States by 2008.
The market in the United States for distributed wind is estimated at 3900 MW by 2020. In Denmark, individuals or wind turbine cooperatives own around 80% of the 5000 wind turbines and had around 77% of the capacity.
Another market for small wind turbines is power for telecommunication stations, with an estimated 500 having small wind turbines as part of the power supply. This is a growing market due to the increased use of cellular phones, especially in the more remote areas of the world.
Small PV/wind systems for street lighting ( Fig. 14) are now on the market. Even though there may be a transmission line nearby, the cost of the transformer and electricity is more than the cost of electricity from the PV/wind system.
Innovative wind turbines have to be evaluated in terms of performance, structural requirements, operation and maintenance, and energy production in relation to constraints and cost of manufacturing. Most innovative wind systems are at the design stage with some even making it to the prototype or demonstration phase. If they become competitive in the market, they would probably be removed from the innovative category. Some examples are tornado type, tethered to reach the high winds of the jet stream, tall tower to use rising hot air, torsion flutter, electrofluid, diffuser augmented, and multiple rotors on same shaft. There have been numerous designs and some prototypes have been built that have different combinations of blades and/or blade shapes. Another innovative example is flying wind turbines, now at the design and prototype stage, which would extract power in the winds at 400 m.
There are also companies that are building wind turbines to mount on buildings in the urban environment. There is an Internet site for urban wind with downloads available. The wind turbines guideline includes images of flow over buildings and example projects. An unusual design for a building is the incorporation of three wind turbines (225 kW each) on the causeways connecting two skyscrapers in Bahrain.
The farm windmill is a long-term application of the conversion of wind energy to mechanical power and it’s well designed for pumping small volumes of water at a relatively high lift. It’s estimated that there are around 300,000 operating farm windmills in the world and the annual production is around 3,000. The rotor has high solidity, large amount of blade material per rotor swept area, which is similar to drag devices. The tip speed ratio is around 0.8, and the annual average power coefficient is 5%-6%.
Different research groups and manufacturers have attempted to improve the performance of the farm windmill and to reduce the cost, especially for developing countries. A wind-electric system is more efficient and can pump enough water for villages or small irrigation. The wind-electric system is a direct connection of the permanent magnet alternator (variable voltage, variable frequency) of the wind turbine to a standard three-phase induction motor driving a centrifugal or submersible pump. Annual power coefficients are around 10%-12%.
2.5 Performance
In the final analysis, performance of wind turbines is reduced to energy production and the value or cost of that energy in comparison to other sources of energy. The annual energy production can be estimated by the following methods:
Generator size (rated power) Rotor area and wind map values Manufacturer's curve of energy versus annual average wind speed The generator size method is a rough approximation as wind turbines with the same size rotors (same area) can have different size generators, but it’s a fairly good first approximation:
AEP = CF *GS *8760 kWh/year or MWh/year
…where …
AEP is the annual energy production CF is the capacity factor GS is the rated power of wind turbine 8760 is the number of hours in a year Capacity factors depend on the rated power versus rotor area as wind turbines' models can have different size generators for same size rotor or same size generators for different size rotors for better performance in different wind regimes. For wind farm capacity factors range from 30% to 45% for class 3 wind regimes to class 5 wind regimes.
Availability is the time the wind turbine is available to operate, whether the wind is or is not blowing. Availability of wind turbines is now in the range of 95%-98%. Availability is also an indication of quality or reliability of the wind turbine. So the AEP is reduced due to availability. If the wind turbine is located at higher elevations, then there is also a reduction for change in density (air pressure component) of around 10% for every 1000 m of elevation.
Since the most important factors are the rotor area and the wind regime, the annual energy production can be estimated from
AEP = CF *Ar * * 8.76 kWh/year M W
… where …
Ar is the area of the rotor, m^2 WM is the value of power/area for that location from wind map, W/m^2 8.76 h/year, which also converts W to kW The manufacturer may provide a curve of annual energy production versus annual average wind speed ( Fig. 15), where AEP is calculated from the power curve for that wind turbine and a wind speed histogram calculated from average wind speed using a Rayleigh distribution.
The best estimate of annual energy production is the calculated value from measured wind speed data and the power curve of a wind turbine (from measured data). The calculated annual energy production is just the multiplication of the power curve value times the number of hours for each bin ( TBL. 2). If the availability is 95% and there is a 10% decrease due to elevation, then the calculate energy production would be around 2600 MWh/year.
The calculated annual energy production is the number from which the economic feasibility of a wind farm project is estimated and the number that is used to justify financing for the project.
Wind speed histograms and power curves have to be corrected to the same height and power curves have to be adjusted for air density at that site. In general, wind speed histograms need to be annual averages from 2 to 3 years of data; however, 1 year of data may suffice if it can be compared to a long term database.
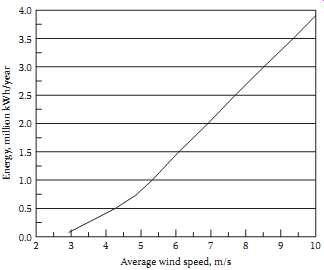
Above: Fig. 15 Manufacturer's curve for estimated annual energy production
as function of average wind speed for 1 MW wind turbine. Energy, million kWh/year;
Average wind speed, m/s
TBL. 2 Calculated Annual Energy Using Power Curve for 1 MW Wind Turbine and Wind Speed Histogram Data for White Deer, Texas (Bin Width = 1 m/s, Data Adjusted to Hub Height of 60 m) Wind Speed, m/s Power, kW Bin, h Energy, kWh
3 Institutional Issues
The institutional issues (non-inclusive as there are surely others) related to renewable energy contain the following: legislation and regulation; environment; incentives; externalities; world treaties and country responses to greenhouse gas emissions; connection to utility grids (large power generators such as wind farms, large PV arrays, concentrating solar power; large numbers of small systems, distributed and community systems); incentives such as feed-in tariffs, renewable portfolio standards, rebates, and tax credits; and certification standards for equipment and installation of systems. Of course most of these issues are determined by politics and economics.
The interconnection of wind turbines to utility grids, regulations on installation and operation, and environmental concerns are the major issues. For a few wind turbines on a large utility grid there would be no problems with the amount of power. It would be considered as a negative load, a conservation device that is the same as turning off a load. For large penetration, 20% and greater, other factors such as the variability of the wind and dispatching become important. The utilities are concerned with safety and power quality due to any wind turbines on their grid.
The main environmental issues are visual impact, noise, birds (avian), and bats. The visual impact can be detrimental, especially in locations that are close to scenic areas or parks. It’s the familiar story; people are in favor of renewable energy, but not in my backyard. Some people are adamantly opposed to wind farms, most are neutral, and the rest are in favor. In the great plains of the United States, wind turbines are generally seen as favorable due to rural economic impact. For those opposed, generally the visual impact is the most important concern. Noise measurements have shown in general that wind turbines are below the ambient noise; however, the repetitive nose from the blades stands out and one would not want their residence in the middle of a wind farm. The whine from gearboxes on some units is also noticeable. However, with larger wind turbines at higher hub heights and new airfoils, the noise has been reduced.
As with any endeavor, politics enters the situation. To make a change in behavior, especially when the competition is an entrenched industry, you need INCENTIVES, PENALTIES, and EDUCATION. Someone estimated that the amount of each type of energy used is in direct proportion to the amount of subsidies for that type of energy. Subsidies are in the form of taxes, tax breaks, and regulations, all of which generally require legislation. What every entity (industry) wants are incentives for themselves and penalties for their competitors. In addition, they want the government to fund R&D and even commercialization. For the United States, incentives are listed by type, amount, and state.
Energy subsidies have generally been in favor of conventional fossil fuels and established energy producers. Subsidies for renewable energy between 1974 and 1997 amounted to $20 billion worldwide. This can be compared with the much larger number for subsidies for conventional energy sources, which was a total of $300 billion per year, and this number does not even take into account the expenditures for infrastructure, safeguards, and military actions for continued flow of oil and natural gas. The privatization of the electric industry along with the restructuring into generation, transmission, and distribution has opened some doors for renewable energy. The federal production tax credit and renewable portfolio standards have had a major impact on the development of wind farms in the United States.
Net metering is where the electric meter runs in either direction. If the renewable energy system produces more electricity than is needed on site, the utility meter runs backward, and if the load on site is greater, then the meter runs forward. Then the bill is determined at the end of the time period, which is generally 1 month. If the renewable energy system produced more energy over the billing period than was used on site, the utility company pays the avoided cost. Most of the states have net metering that ranges from 10 to 1000 kW, with most in the 10-100 kW range.
Green power is a voluntary consumer decision to purchase electricity supplied from renewable energy sources or to contribute funds for the utility to invest in renewable energy development. Green power is an option in some states' policy and also has been driven by responses of utilities to customer surveys and town meetings. Green power is available to retail or wholesale customers in 22 states.
Externalities are defined as social or external costs/benefits, which are attributable to an activity that is not borne by the parties involved in that activity. Externalities are not paid by the producers or consumers and are not included in the market price, although someone at sometime will pay for or be affected by them. Social benefits, generally called subsidies, are paid by someone else and accrue to a group.
4 Economics
The most critical factors are (1) initial cost of the installation and (2) the net annual energy production.
If the system is connected to the grid, the next important factor is the value of that energy. For wind farms it’s the value of the electricity sold to the utility company, for using energy on site, it’s generally the value of the electricity displaced, the retail value. In determining economic feasibility, wind energy must compete with the energy available from competing technologies. Natural gas and oil prices have had large fluctuations in the past few years and the future prices for fossil fuels are uncertain, especially when carbon emissions are included. For the United States, if the military costs for insuring the flow of oil from the Middle East were included, that would probably add $0.15-0/30 per liter ($0.50-1.00/gal) to the cost of gasoline. The return from the energy generated should exceed all costs in a reasonable time.
For remote locations where there is no electricity, high values for electricity from renewable energy is probably cost competitive with other sources of energy. Of course all values for electricity produced by wind power depend on the resource, so there is a range of values.
Economic analyses both simple and complicated provide guidelines and simple calculations should be made first. Detailed economic analyses provide information for commercial operations, primarily wind farms. Commonly calculated quantities are (1) simple payback, (2) cost of energy (COE), and (3) cash flow. A simple payback calculation can provide a preliminary judgment of economic feasibility for a wind energy system. The easiest calculation is the cost of the system divided by cost (or value of energy) displace per year.
A life cycle cost (LCC) analysis gives the total cost of the system, including all expenses incurred over the life of the system and salvage value, if any. There are two reasons to do an LCC analysis: (1) to compare different power options and (2) to determine the most cost-effective sys tem designs. The competing options to small renewable energy systems are batteries or small diesel generators. For these applications the initial cost of the system, the infrastructure to operate and maintain the system, and the price people pay for the energy are the main concerns. However, even if small renewable systems are the only option, a LCC analysis can be helpful for comparing costs of different designs and/or determining whether a hybrid system would be a cost-effective option. An LCC analysis allows the designer to study the effect of using different components with different reliabilities and lifetimes.
The COE (value of the energy produced by the wind system) gives a levelized value over the life of the system. The lifetime depends on the type of system and is assumed to be 20-25 years for wind turbines.
The Electric Power Research Institute (EPRI Tag-Supply method), includes levelized replacement costs (major repairs) and fuel costs [28]; however, for wind energy the fuel costs are zero. The COE is primarily driven by the installed cost and the annual energy production:
COE IC FCR LRC AOM AEP
=
+ + ( * )
…where IC is the installed cost FCR is the fixed charged rate LRC is the levelized replacement cost AOM is the annual operation and maintenance cost AEP is the annual energy production (net)
The COE can be calculated for $/kWh or $/MWh and the last term could be separate as AOM/AEP, again in terms of $/kWh or $/MWh. It may be difficult to obtain good numbers for LCR since repair costs are generally proprietary. One method is to use a 20 year lifetime and estimate LCR as IC/20. That means the major repairs are equal to the initial cost spread over the lifetime.
Example: Wind turbine in a good wind regime.
1 MW, IC = $2,000,000, FCR = 0.07, AEP = 3000 MWh/ year, LRC = $100,000/year, AOM = $8/MWh
COE = ($2,000,000 * 0.07 + $100,000)/3000 + 8 = 80 + 8 = $88//MWh
The COE for wind turbines in a wind farm has decreased over the years ( Fig. 16); however, installed costs increased from $1.2 million/MW in 2003 to over $2 million/MW in 2010 (both in $ 2010). Remember these are average values for good wind regimes, while earlier values were for excellent wind regimes.
The COE for wind farms is around $80/MWh ( Fig. 17) without incentives and is competitive with fossil fuels for generating electricity. There are economies of scale for wind and COE for wind farms is less than the COE for small wind systems for residences, agribusiness, and even community and distributed wind ( TBL. 3). The annual energy production is estimated by the generator size method in a good wind regime, and capacity factors of 25%-35% were used.
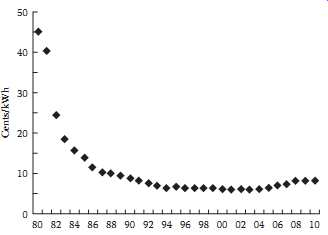
Above: Fig. 16 Cost of energy for wind turbines has declined dramatically
since 1980. There is actually a range of values depending on resource, so plotted
values are averages for large systems and locations with good to excellent
resource.
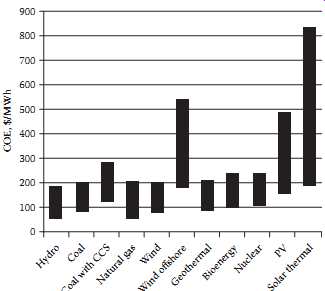
Above: Fig. 17 Estimated levelized cost of new generation resources, 2016
($2009), data from Energy Information Administration. (From Levelized cost
of new generation resources in the annual energy outlook 2011, U.S. Energy
Information Administration
The capital cost is the major cost for a project and of that the wind turbine is the major component ( TBL. 4). Most renewable energy projects will be similar in that equipment costs are the major item.
The installed cost for offshore wind farms is around two times that of wind farms on land.
The value to the landowner can be estimated from the annual energy production and/or MW installed:
1. Royalty on production, 4%-6% with escalation, generally at 10 year periods
2. $4000 to $6000/MW installed per year
3. Combination, (1) or (2), whichever is larger
===
TBL. 3 COE for Wind Turbines in Good Wind Resource Area
===
TBL. 4 Percent Cost for Wind Farm Installation Component Turbine Foundation Electric Connections to grid Land Roads, ditching Consultants, resource assessment, other.
===
The return to the landowner is higher than ranching or farming as only 2%-3% of the land is removed from production, primarily for roads (see Fig. 12).
5 Summary
Wind power from wind farms has become a major component for new power installations in many regions of the world. Annual capacity factors range from 0.30 to 0.45 at good to excellent wind locations.
One limitation for wind power is that, in general, windy areas are distant from major load centers and wind farms can be installed faster than construction of new transmission lines for the utility grid. As wind power increases beyond 20% penetration into the grid, more strict requirements from power grid operators will be required, such as wind power output forecasting, power quality, fault (low voltage) ride through, etc., similar to conventional power plants.
If storage becomes economical, then renewable energy and especially wind power will supply even more of the world demand for electric energy. At the moment, pumped storage is most economical and should be considered with long-distance extra-high-voltage transmission lines during national electrical power system planning, to accommodate more wind and solar power penetration into large grids.
There is a growing market for small wind turbines for stand-alone and grid connection and midsize wind turbines for the distributed and community market. The market potential for village power is large; however, there are still problems, primarily institutional and economic costs for these communities.
Past estimates of future installation of wind power have been low, so now the planned installations are at least feasible, for example, the proposal, 20% by 2030 for the United States. China will probably become the leader in manufacturing of large wind turbines due to their large increase in installed capacity since 2008 and due to goal of 300 MW by 2020. Ten percent of electricity by wind power for the world by 2020 would require around 1000 GW.
The world faces a tremendous energy problem in terms of supply and in terms of emissions from the use of fossil fuels. The first priority is conservation and energy efficiency and the second is a shift to renewable energy for a sustainable energy future. This shift has started to occur and renewable energy market will grow rapidly over next 30 years.
Links
- Global Wind Energy Council, www.gwec.net.
- American Wind Energy Association, www.awea.org.
- European Wind Energy Association, www.ewea.org.
- Alternative Energy Institute, www.windenergy.org.
- National Wind Technology Center, NREL, www.nrel.gov/wind.
- Many countries have wind energy associations.